Menu
▾
▴
gnuplot-info — For questions and discussion about gnuplot
You can subscribe to this list here.
| 2003 |
Jan
|
Feb
|
Mar
|
Apr
|
May
|
Jun
|
Jul
|
Aug
|
Sep
|
Oct
(2) |
Nov
(2) |
Dec
|
|---|---|---|---|---|---|---|---|---|---|---|---|---|
| 2004 |
Jan
(3) |
Feb
(1) |
Mar
(2) |
Apr
(22) |
May
(52) |
Jun
(43) |
Jul
(36) |
Aug
(59) |
Sep
(37) |
Oct
(55) |
Nov
(39) |
Dec
(36) |
| 2005 |
Jan
(64) |
Feb
(40) |
Mar
(62) |
Apr
(58) |
May
(256) |
Jun
(77) |
Jul
(80) |
Aug
(39) |
Sep
(56) |
Oct
(36) |
Nov
(113) |
Dec
(68) |
| 2006 |
Jan
(43) |
Feb
(64) |
Mar
(69) |
Apr
(60) |
May
(71) |
Jun
(53) |
Jul
(63) |
Aug
(63) |
Sep
(76) |
Oct
(85) |
Nov
(82) |
Dec
(73) |
| 2007 |
Jan
(75) |
Feb
(82) |
Mar
(84) |
Apr
(104) |
May
(67) |
Jun
(101) |
Jul
(107) |
Aug
(138) |
Sep
(128) |
Oct
(106) |
Nov
(112) |
Dec
(112) |
| 2008 |
Jan
(94) |
Feb
(87) |
Mar
(146) |
Apr
(169) |
May
(75) |
Jun
(26) |
Jul
(26) |
Aug
(7) |
Sep
(18) |
Oct
(53) |
Nov
(42) |
Dec
(19) |
| 2009 |
Jan
(43) |
Feb
(39) |
Mar
(18) |
Apr
(45) |
May
(66) |
Jun
(87) |
Jul
(56) |
Aug
(41) |
Sep
(56) |
Oct
(139) |
Nov
(98) |
Dec
(88) |
| 2010 |
Jan
(81) |
Feb
(79) |
Mar
(83) |
Apr
(97) |
May
(124) |
Jun
(84) |
Jul
(53) |
Aug
(85) |
Sep
(89) |
Oct
(50) |
Nov
(98) |
Dec
(78) |
| 2011 |
Jan
(97) |
Feb
(74) |
Mar
(68) |
Apr
(54) |
May
(63) |
Jun
(59) |
Jul
(65) |
Aug
(58) |
Sep
(37) |
Oct
(40) |
Nov
(59) |
Dec
(35) |
| 2012 |
Jan
(16) |
Feb
(56) |
Mar
(63) |
Apr
(25) |
May
(48) |
Jun
(58) |
Jul
(20) |
Aug
(13) |
Sep
(43) |
Oct
(35) |
Nov
(20) |
Dec
(17) |
| 2013 |
Jan
(22) |
Feb
(11) |
Mar
(51) |
Apr
(34) |
May
(57) |
Jun
(27) |
Jul
(70) |
Aug
(30) |
Sep
(38) |
Oct
(53) |
Nov
(40) |
Dec
(25) |
| 2014 |
Jan
(26) |
Feb
(35) |
Mar
(60) |
Apr
(12) |
May
(17) |
Jun
(15) |
Jul
(9) |
Aug
(18) |
Sep
(46) |
Oct
(18) |
Nov
(19) |
Dec
(15) |
| 2015 |
Jan
(17) |
Feb
(28) |
Mar
(21) |
Apr
(54) |
May
(36) |
Jun
(8) |
Jul
(30) |
Aug
(13) |
Sep
(3) |
Oct
(28) |
Nov
(3) |
Dec
(3) |
| 2016 |
Jan
(11) |
Feb
(9) |
Mar
(29) |
Apr
(10) |
May
(8) |
Jun
(5) |
Jul
(50) |
Aug
(57) |
Sep
(13) |
Oct
(5) |
Nov
(17) |
Dec
(11) |
| 2017 |
Jan
(3) |
Feb
(23) |
Mar
(16) |
Apr
(7) |
May
(15) |
Jun
(12) |
Jul
(48) |
Aug
(15) |
Sep
(3) |
Oct
(20) |
Nov
(28) |
Dec
(21) |
| 2018 |
Jan
(13) |
Feb
(21) |
Mar
(21) |
Apr
(7) |
May
(3) |
Jun
(7) |
Jul
(27) |
Aug
(38) |
Sep
(4) |
Oct
(30) |
Nov
(22) |
Dec
|
| 2019 |
Jan
(5) |
Feb
(16) |
Mar
(1) |
Apr
(9) |
May
(7) |
Jun
(20) |
Jul
(13) |
Aug
(3) |
Sep
(2) |
Oct
(2) |
Nov
(2) |
Dec
(4) |
| 2020 |
Jan
(6) |
Feb
(11) |
Mar
(1) |
Apr
(18) |
May
(4) |
Jun
(5) |
Jul
(12) |
Aug
(1) |
Sep
(3) |
Oct
(7) |
Nov
(1) |
Dec
(17) |
| 2021 |
Jan
(1) |
Feb
(11) |
Mar
(16) |
Apr
(6) |
May
(5) |
Jun
(1) |
Jul
(1) |
Aug
(2) |
Sep
(8) |
Oct
(10) |
Nov
(4) |
Dec
(4) |
| 2022 |
Jan
(9) |
Feb
(35) |
Mar
(4) |
Apr
|
May
(3) |
Jun
(49) |
Jul
(11) |
Aug
|
Sep
(5) |
Oct
(2) |
Nov
(16) |
Dec
(13) |
| 2023 |
Jan
|
Feb
(8) |
Mar
(3) |
Apr
|
May
(8) |
Jun
|
Jul
(5) |
Aug
|
Sep
|
Oct
(2) |
Nov
|
Dec
(2) |
| 2024 |
Jan
(6) |
Feb
(9) |
Mar
|
Apr
(26) |
May
(24) |
Jun
|
Jul
(4) |
Aug
(2) |
Sep
(1) |
Oct
(10) |
Nov
(9) |
Dec
|
| 2025 |
Jan
|
Feb
(22) |
Mar
|
Apr
(1) |
May
|
Jun
|
Jul
|
Aug
|
Sep
(1) |
Oct
(1) |
Nov
|
Dec
(4) |
| 2026 |
Jan
|
Feb
(24) |
Mar
(20) |
Apr
(18) |
May
(2) |
Jun
(2) |
Jul
(2) |
Aug
(3) |
Sep
|
Oct
|
Nov
|
Dec
|
|
From:
<br...@ph...> - 2006-04-26 21:02:23
|
Dale E Sterner wrote: > In windows gnuplot plots with a white background but in naked DOS it > plots with a black background. > Is there any way to control the background in naked dos? No, I don't think there is. At least not in what is probably the only raw DOS screen terminal driver that still works, these days: svga on DJGPP via GRX20. |
|
From: Dale E S. <sun...@ju...> - 2006-04-26 16:51:16
|
In windows gnuplot plots with a white background but in naked DOS it plots with a black background. Is there any way to control the background in naked dos? cheers DS |
|
From: Charles P. W. <cpw...@cp...> - 2006-04-26 13:43:58
|
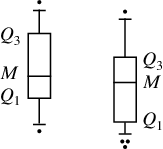
On Wed, 2006-04-26 at 12:21 +0200, Hans-Bernhard Br=C3=B6ker wrote: > Charles P. Wright wrote: > > I would like to have the maximum and minimum values have a horizontal > > line as in: > > http://mathworld.wolfram.com/images/eps-gif/BoxandWhiskers_1000.gif >=20 > Then please read 'help candlesticks' and note how it points you to 'set= =20 > bars'. Which happens to do what you're looking for. Hans, Thanks for the reply, but I've tried adding "set bars" with out success. The "set boxwidth" does control the width of the bars as advertised. If you read the "set bars" help it actually claims to set the box width not the tics: The `set bars` command controls the tics at the ends of error bars, and also the width of the boxes in plot styles candlesticks and financebars. The help candlesticks is a bit ambiguous: The width of the rectangle can be controlled by the `set boxwidth` comma= nd. For backwards compatibility with earlier gnuplot versions, when the boxwidth parameter has not been set then the width of the candlestick rectangle is controlled by `set bars <width>`. It seems because I do have a set boxwidth, the set bars should produce ticks, but they don't. The following script produces the attached plot. Even though I set the tick width using "set bars", they don't show up. Charles set yrange [0:400]; set ytics nomirror; set boxwidth 0.25; set bars 0.125; set xtics nomirror ("VANILLA" 0.23, "VANSYNC" 0.53, "STRACE" 0.82, "AMINOTRACE" 1.12, "AMINONULL" 1.43, "AMINOACI" 1.73, "AMINOACID" 2.03) set xrange [0:2.25] set ylabel "Operations/second" font 'Helvetica,15'; set offsets 0.125,0.0; set size 1.5,1; set key top right; set output "random-write-1-bp.png" set terminal png; plot "/tmp/foo.dat" index 0 title "Op/s" axes x1y1 with candlestick , "/tmp/foo.dat" index 1 notitle axes x1y1 with candlestick ; [cwright@localhost data]$ gnuplot --version gnuplot 4.0 patchlevel 0 |
|
From: Charles P. W. <cw...@cs...> - 2006-04-26 04:59:07
|
Hello, I'm trying to make box plots with the candlesticks style, and I've got things mostly the way that I want them. I've got the quartiles, minimum and maximum, and even a horizontal bar for the median (by overlaying an extra plot over the first candlestick). I would like to have the maximum and minimum values have a horizontal line as in: http://mathworld.wolfram.com/images/eps-gif/BoxandWhiskers_1000.gif I know that I could do this by overlaying a third and fourth plot for the minimum and maximum (just like the samples do for the median), but I am wondering if there is a cleaner way to do it. Charles |
|
From: Paulo J. M. <poc...@gm...> - 2006-04-25 17:12:22
|
On 25/04/06, Hans-Bernhard Br=F6ker <br...@ph...> wrote: > Paulo J. Matos wrote: > > On 25/04/06, Hans-Bernhard Br=F6ker <br...@ph...> wro= te: > >> Paulo J. Matos wrote: > > >>> 1. Although I have a logscale plot I would like it to show 0,0 as > >>> original instead of 0.01, 0.01. Can I do this? > > >> Not automatically --- nor should you want to. Why do you want to lie = to > >> the reader of your plot? > > > Not a lie... Just thought that a graph starting at 0,0 would look nicer= . :) > > It wouldn't look nice, it'd simply look *wrong*. Labelling that tick > with "0" means you, the author of this diagram, claim that this is the > zero is on this axis. But that's not the case, so this claim is quite > definitely a lie. > > > 1 - I don't have my figs in the same place as the latex files so when > > including I get a path problem in the generated tex file by gnuplot > > which assumes the eps are in the same path of the latex main files. > > Not a problem at all, I just manually change the generated tex but is > > there anyway of doing this from gnuplot? > > No. But you don't have to: LaTeX has path search mechanisms to find > files. Use them, and you won't have to edit generated TeX fragments. > Or, if you really don't want to have two files, see the documentation of > epslatex (or pslatex) on how to make it put the PostScript stuff > directly into the TeX file. > > > 2 - How can I change the Latex letters? generated by the tex file? I ha= ve: > > set terminal epslatex color solid "default" 8 > > But changing 8 from 10 doesn't seem to change the size at all. > > IIRC, it's not supposed to. Font "default" means the figure will use > whatever LaTeX's font is at the point of inclusion. I.e. you can change > this in the master document, at the point where you include the file > generated by gnuplot. You really have to read the documentation more. > Thanks! :) I would love to really have more time to read the documentation carefully but right now I'm quite in a hurry. I appreciate your comments. > > -- Paulo Jorge Matos - pocm at sat inesc-id pt Web: http://sat.inesc-id.pt/~pocm Computer and Software Engineering INESC-ID - SAT Group |
|
From:
<br...@ph...> - 2006-04-25 15:11:57
|
Paulo J. Matos wrote: > On 25/04/06, Hans-Bernhard Bröker <br...@ph...> wrote: >> Paulo J. Matos wrote: >>> 1. Although I have a logscale plot I would like it to show 0,0 as >>> original instead of 0.01, 0.01. Can I do this? >> Not automatically --- nor should you want to. Why do you want to lie to >> the reader of your plot? > Not a lie... Just thought that a graph starting at 0,0 would look nicer. :) It wouldn't look nice, it'd simply look *wrong*. Labelling that tick with "0" means you, the author of this diagram, claim that this is the zero is on this axis. But that's not the case, so this claim is quite definitely a lie. > 1 - I don't have my figs in the same place as the latex files so when > including I get a path problem in the generated tex file by gnuplot > which assumes the eps are in the same path of the latex main files. > Not a problem at all, I just manually change the generated tex but is > there anyway of doing this from gnuplot? No. But you don't have to: LaTeX has path search mechanisms to find files. Use them, and you won't have to edit generated TeX fragments. Or, if you really don't want to have two files, see the documentation of epslatex (or pslatex) on how to make it put the PostScript stuff directly into the TeX file. > 2 - How can I change the Latex letters? generated by the tex file? I have: > set terminal epslatex color solid "default" 8 > But changing 8 from 10 doesn't seem to change the size at all. IIRC, it's not supposed to. Font "default" means the figure will use whatever LaTeX's font is at the point of inclusion. I.e. you can change this in the master document, at the point where you include the file generated by gnuplot. You really have to read the documentation more. |
|
From: Paulo J. M. <poc...@gm...> - 2006-04-25 14:39:16
|
On 25/04/06, Hans-Bernhard Br=F6ker <br...@ph...> wrote: > Paulo J. Matos wrote: > > > 1. Although I have a logscale plot I would like it to show 0,0 as > > original instead of 0.01, 0.01. Can I do this? > > Not automatically --- nor should you want to. Why do you want to lie to > the reader of your plot? > Not a lie... Just thought that a graph starting at 0,0 would look nicer. :) > > 2. I have removed right and top borders but still there are some wierd > > tics that are still there. Even after those unset tics (which don't > > seem to affect the tics at all). How can I remove them? > > Those are not the x2 and y2 tics, which you did remove. They're the > mirrored x and y tics: > > set xtics nomirror > set ytics nomirror > Thanks. > > 3. There are two labels, one for the points and other for the x > > function which I would like to remove, how can I do that? > > Read "help plot" about the "title" option. > notitle is nice! :) > > 4. What's the best to include in latex? latex terminal or epslatex term= inal? > > Almost always epslatex. "latex" is a fall-back for special or desparate > cases. > Thanks, yet, 2 questions: 1 - I don't have my figs in the same place as the latex files so when including I get a path problem in the generated tex file by gnuplot which assumes the eps are in the same path of the latex main files. Not a problem at all, I just manually change the generated tex but is there anyway of doing this from gnuplot? 2 - How can I change the Latex letters? generated by the tex file? I have: set terminal epslatex color solid "default" 8 But changing 8 from 10 doesn't seem to change the size at all. Is it this? Or is there any other way? Thanks, Paulo Matos > > ------------------------------------------------------- > Using Tomcat but need to do more? Need to support web services, security? > Get stuff done quickly with pre-integrated technology to make your job ea= sier > Download IBM WebSphere Application Server v.1.0.1 based on Apache Geronim= o > http://sel.as-us.falkag.net/sel?cmd=3Dlnk&kid=3D120709&bid=3D263057&dat= =3D121642 > _______________________________________________ > Gnuplot-info mailing list > Gnu...@li... > https://lists.sourceforge.net/lists/listinfo/gnuplot-info > -- Paulo Jorge Matos - pocm at sat inesc-id pt Web: http://sat.inesc-id.pt/~pocm Computer and Software Engineering INESC-ID - SAT Group |
|
From:
<br...@ph...> - 2006-04-24 23:35:00
|
Paulo J. Matos wrote: > 1. Although I have a logscale plot I would like it to show 0,0 as > original instead of 0.01, 0.01. Can I do this? Not automatically --- nor should you want to. Why do you want to lie to the reader of your plot? > 2. I have removed right and top borders but still there are some wierd > tics that are still there. Even after those unset tics (which don't > seem to affect the tics at all). How can I remove them? Those are not the x2 and y2 tics, which you did remove. They're the mirrored x and y tics: set xtics nomirror set ytics nomirror > 3. There are two labels, one for the points and other for the x > function which I would like to remove, how can I do that? Read "help plot" about the "title" option. > 4. What's the best to include in latex? latex terminal or epslatex terminal? Almost always epslatex. "latex" is a fall-back for special or desparate cases. |
|
From: Paulo J. M. <poc...@gm...> - 2006-04-24 17:50:08
|
Hi all, I'm trying to plot some points in a cartesian plane. The points are in a file and I have the following: set terminal x11 # Set terminal (output type) set logscale xy # Set logscale on xy set border 3 # Remove right and top borders set xlabel "X" set ylabel "Y" set size square set style data points unset label unset y2tics unset my2tics unset x2tics unset mx2tics plot [0.01:3600] [0.01:3600] 'data.dat' using 2:1, x 1. Although I have a logscale plot I would like it to show 0,0 as original instead of 0.01, 0.01. Can I do this? 2. I have removed right and top borders but still there are some wierd tics that are still there. Even after those unset tics (which don't seem to affect the tics at all). How can I remove them? 3. There are two labels, one for the points and other for the x function which I would like to remove, how can I do that? 4. What's the best to include in latex? latex terminal or epslatex terminal= ? Thanks in advance, -- Paulo Jorge Matos - pocm at sat inesc-id pt Web: http://sat.inesc-id.pt/~pocm Computer and Software Engineering INESC-ID - SAT Group |
|
From: Daniel G. <li...@da...> - 2006-04-24 15:37:56
|
>Daniel Graupner wrote: > >You'd have fared better with > > set size 1,0.8 > set multiplot layout 1,2 > I tried before, without sucess. The following works as expected: set size 1,0.9 set multiplot layout 1,2 scale 1,0.8 The results are different among different terminals, that is what I am confused about. Looks good now. Regards, Daniel. |
|
From:
<br...@ph...> - 2006-04-24 15:20:21
|
Daniel Graupner wrote: > I have another question related to multiplot. with "layout 1,2" I > draw 2 plots side by side, so they have the same height as a single > plot and the width is divided. These two plots look not very good > because they are stretched. Well, thats my own sensation, but it > annoys me. > > So I tried, > > set multiplot layout 1,2 size 1,0.8 You'd have fared better with set size 1,0.8 set multiplot layout 1,2 'set size' at the point you 'set multiplot' is what governs the BoundingBox of an eps or pslatex output in gnuplot. Some terminals now have their own "size" option to perhaps make this more intuitive. |
|
From: Daniel G. <li...@da...> - 2006-04-24 15:03:04
|
>Daniel Graupner wrote: >You weren't placing these side by side, were you? At least you didn't >mention anything of the sort until now. yes, my failure, I used...just missed in the mail. set multiplot layout 1,2. I have another question related to multiplot. with "layout 1,2" I draw 2 plots side by side, so they have the same height as a single plot and the width is divided. These two plots look not very good because they are stretched. Well, thats my own sensation, but it annoys me. So I tried, set multiplot layout 1,2 size 1,0.8 the plots look good for me now, but the problem is that the canvas (or better call it terminal??) everytime has size 1,1. Therefore I get empty space above the diagrams (the missing 20%). This looks very ugly in latex. Is there a possibility to clip the whole drawing area or any other option to avoid the empty space. Thanks for your answers, Daniel Graupner. |
|
From:
<br...@ph...> - 2006-04-24 14:52:08
|
Daniel Graupner wrote: >> Daniel Graupner wrote: > Hmm, I thought the use case for multiplot is to draw more than one > plot on one page. Close, but not quite. It's to draw multiple independent plots on one page. Plots sharing an x axis aren't independent. If you're using 'set multiplot', but not 'set size' or 'set origin' (or the "set multiplot layout" option new in 4.1), you're probably misusing multiplot. > Why bothering about axes? I have two plots and I > want to place them side by side, multiplot allows for that. You weren't placing these side by side, were you? At least you didn't mention anything of the sort until now. >> Not very strange. LaTeX (or rather the graphicx package, to be >> precise) does depend on the filename extension to guess what type >> of file you > Well yes, but is it correct that gnuplot produces a tex file that > does not contain this information? It contains the information you told it to contain. It's actually on purpose that the filename in an epslatex terminal output is given without the extension. That allows to run epstopdf on the .eps part, so the LaTeX part will work under pdflatex without editing. |
|
From: Daniel G. <li...@da...> - 2006-04-24 14:37:30
|
>Daniel Graupner wrote: >> My plot is multiplot, the first one has an yrange from 0 to 14000 the >> second from 0 to 5, xrange is the same. > >That indicates you're abusing multiplot. You should almost certainly >have either used the secondary y axis to do both plots in one diagram >without multiplot mode Hmm, I thought the use case for multiplot is to draw more than one plot on one page. Why bothering about axes? I have two plots and I want to place them side by side, multiplot allows for that. Plotting in one diagram is too complex and does not fit my needs >> I used labels and arrows in the first one, in multiplot they are >> drawn in both plots but due to the coordinate difference they do not >> show up in plot 2. > >Whether that's true depends on what you mean by "show up". The gnuplot mean that it is not drawn, I do not see anything in the second plot with the x11 terminal (png also). >core does try to draw those things --- in versions up to 4.0, it partly >depends on the terminal driver what happens if they're outside the >visible range. Yes, makes sense. >Not very strange. LaTeX (or rather the graphicx package, to be precise) >does depend on the filename extension to guess what type of file you Well yes, but is it correct that gnuplot produces a tex file that does not contain this information? I mean, the file does not work out-of-the box in my case. What is the intension of this behaviour? Regards, Daniel. |
|
From:
<br...@ph...> - 2006-04-24 14:11:37
|
Daniel Graupner wrote: >> In every latex run I get a Failure: >> gnuplotgeneratedtex:294:Dimension too large. \gplbacktext > I recently identified the problem. > My plot is multiplot, the first one has an yrange from 0 to 14000 the > second from 0 to 5, xrange is the same. That indicates you're abusing multiplot. You should almost certainly have either used the secondary y axis to do both plots in one diagram without multiplot mode set ytics nomirror ; set y2tics plot 'data1' u 1:2 axes x1y1, 'data2' u 1:2 axes x1y2 or you could have re-scaled one of the datasets on-the-fly: plot 'data1' u 1:2, 'data2' u 1:($2/5.0*14000) > I used labels and arrows in the first one, in multiplot they are > drawn in both plots but due to the coordinate difference they do not > show up in plot 2. Whether that's true depends on what you mean by "show up". The gnuplot core does try to draw those things --- in versions up to 4.0, it partly depends on the terminal driver what happens if they're outside the visible range. That set aside, you probably should have use 'graph' or 'screen' coordinates, not data-driven ones, to positions those labels. See "help coordinate". > I just put "unset label" and "unset arrow" before the second plot and > it works. The other error I got was that latex was not able to > determine the size of the eps...fixed this by adding the extension > ".eps" to the filename...strange. Not very strange. LaTeX (or rather the graphicx package, to be precise) does depend on the filename extension to guess what type of file you have, and what to do with it. If the file's called *.eps, LaTeX can peek inside and find the BoundingBox. If it's not *.eps, LaTeX expects to find size information about the image elsewhere. |
|
From: Daniel G. <li...@da...> - 2006-04-24 13:36:15
|
>In every latex run I get a Failure: >gnuplotgeneratedtex:294:Dimension too large. \gplbacktext I recently identified the problem. My plot is multiplot, the first one has an yrange from 0 to 14000 the second from 0 to 5, xrange is the same. I used labels and arrows in the first one, in multiplot they are drawn in both plots but due to the coordinate difference they do not show up in plot 2. Unfortunately they do in the tex file...with coordinates that do not seem to make sense...very high. I just put "unset label" and "unset arrow" before the second plot and it works. The other error I got was that latex was not able to determine the size of the eps...fixed this by adding the extension ".eps" to the filename...strange. Regards, Daniel |
|
From: Daniel G. <li...@da...> - 2006-04-24 12:07:17
|
Hello,

my script generates a simple plot and uses epslatex as terminal:
set terminal epslatex input color 7

On the latex side I include:
\begin{figure}[htb]
\input{texfilename}
\caption{caption}
\end{figure}

In every latex run I get a Failure:
gnuplotgeneratedtex:294:Dimension too large. \gplbacktext

Commenting \gplbacktext out works, but this is not the solution ;-). Where is the problem. I use gnuplot 4.1 from cvs...updated several months ago.

Regards,
Daniel.
|
|
From:
<br...@ph...> - 2006-04-24 09:35:35
|
bulent yilmaz wrote: > Using Enhanced Postscript terminal, I want to use fraction in the > Labels of my plot. What I mean is, for instance, in the label of x > axis I want to have a fraction consisting of numerator and > denominator. > set xlabel 'A/B' -> not like that but the real mathematical look of > the ratio. Something like set xlabel '@^A@_B-' may work. Read "help enhanced" very carefully to understand what this does. If that PostScript code is going to end up in a TeX'ed document, I strongly recommend pslatex instead of postscript terminal --- that allows you to write actual TeX syntax in the plot's text elements. |
|
From: bulent y. <e1...@me...> - 2006-04-24 08:55:44
|
Dear Sir/Madam, I would like to ask a question for which I checked gnuplot FAQ and some other sources but could not find a solution. I would appriciate it a lot if you can help me. Using Enhanced Postscript terminal, I want to use fraction in the Labels of my plot. What I mean is, for instance, in the label of x axis I want to have a fraction consisting of numerator and denominator. set xlabel 'A/B' -> not like that but the real mathematical look of the ratio. Could you tell me how can it be achieved? Thank you. Best Regards, Bulent Yilmaz |
|
From:
<br...@ph...> - 2006-04-23 14:16:39
|
tce...@un... wrote: > 1) my delete-key does not work. when i press it just some cryptic signs > appear but no sign is deleted. That almost certainly has nothing at all to do with gnuplot. It's a problem with your keyboard mapping. > 2) when i first type in "" and then type between it some german signs like > (ue, oe, etc.) then there appear just some cryptic signs, too. *Where* do those appear? In the command shell, or later, in the plot? Looks like your terminal's font isn't capable of displaying umlaut characters in the encoding chosen by your keyboard input method. > is it an encoding issue? Partially. > i have tested various encodings with "set encoding" "set encoding" only concerns the encoding of the plots, not that of your command line shell. You'll have to fix your terminal first > (i am running ubuntu dapper drake beta) If that includes running a binary distributed by them, you're asking the wrong people. Bring this up with their package maintainer. |
|
From: <tce...@un...> - 2006-04-23 13:55:15
|
hello, i have some encoding issue with gnuplot. 1) my delete-key does not work. when i press it just some cryptic signs appear but no sign is deleted. 2) when i first type in "" and then type between it some german signs like (ue, oe, etc.) then there appear just some cryptic signs, too. is it an encoding issue? i have tested various encodings with "set encoding" (i am running ubuntu dapper drake beta) regards, schneenacht |
|
From:
<br...@ph...> - 2006-04-18 18:18:07
|
Olivarius wrote: > I installed Gnuplot on my computer which runs under Windows XP > Everything works well except the terminal. I have a problem with > caracteres which are too small and so I can't read anything on the terminal. This is because after 10 years of apparently flawless work, apparently as of Windows XP, Microsoft changed something in how the default font is determined that broke gnuplot's text window output. We never figured out how to fix that, be there's a known cure: 1) right-click in the invisible window, "Choose Font...", choose a legible one 2) drag the text window to a useful size and position 3) right-click again, "Update [...]wgnuplot.ini". |
|
From: kf.moriyama <km...@mb...> - 2006-04-18 12:08:29
|
Sorry for very late reply and maybe somebody might have answered. But, I wanted the samething and I made a patch for it. http://www22.ocn.ne.jp/~moriyama/gnuplot/gnuplot-e.html You can do what you want by plot "data_file" w l, "" every 50 w p but it takes more typing. mori > I want to plot all the data in a "line", however, I also want to > put some "point marks" (such as rectangle, asterisk etc) for some > of the points. Can anyone help me on this? > > Basically, I have a large set of data, if I use linespoints for ploting, I > cannot differeniate the linespoints for different data set (because there > are so many points). On the other hand, if I use the every command, some > data value will be ignored. > > Many thanks, > -- > Zhenhai Duan |
|
From: Olivarius <oli...@gm...> - 2006-04-18 10:37:45
|
Hi, I installed Gnuplot on my computer which runs under Windows XP Everything works well except the terminal. I have a problem with caracteres which are too small and so I can't read anything on the terminal. How can I solve this problem ? Thx for your help Olivarius |
|
From: MAILER D. <> - 2006-04-17 09:05:57
|
QkFOTkVEIEZJTEVOQU1FIEFMRVJUCgpZb3VyIG1lc3NhZ2UgdG86IHN1cHBv cnRAdGVjaHNtaXRoLmNvbQp3YXMgYmxvY2tlZCBieSBvdXIgU3BhbSBGaXJl d2FsbC4gVGhlIGVtYWlsIHlvdSBzZW50IHdpdGggdGhlIGZvbGxvd2luZyBz dWJqZWN0IGhhcyBOT1QgQkVFTiBERUxJVkVSRUQ6CgpTdWJqZWN0OiBJIGxv dmUgeW91IQoKQW4gYXR0YWNobWVudCBpbiB0aGF0IG1haWwgd2FzIG9mIGEg ZmlsZSB0eXBlIHRoYXQgdGhlIFNwYW0gRmlyZXdhbGwgaXMgc2V0IHRvIGJs b2NrLgoKCg== |
635 messages has been excluded from this view by a project administrator.