Menu
▾
▴
[Gnuplot-info] Box Plots with Candlesticks
|
From: Charles P. W. <cw...@cs...> - 2006-04-26 04:59:07
|
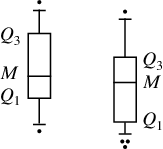
Hello, I'm trying to make box plots with the candlesticks style, and I've got things mostly the way that I want them. I've got the quartiles, minimum and maximum, and even a horizontal bar for the median (by overlaying an extra plot over the first candlestick). I would like to have the maximum and minimum values have a horizontal line as in: http://mathworld.wolfram.com/images/eps-gif/BoxandWhiskers_1000.gif I know that I could do this by overlaying a third and fourth plot for the minimum and maximum (just like the samples do for the median), but I am wondering if there is a cleaner way to do it. Charles |