
Menu
▾
▴
gnuplot-info — For questions and discussion about gnuplot
You can subscribe to this list here.
| 2003 |
Jan
|
Feb
|
Mar
|
Apr
|
May
|
Jun
|
Jul
|
Aug
|
Sep
|
Oct
(2) |
Nov
(2) |
Dec
|
|---|---|---|---|---|---|---|---|---|---|---|---|---|
| 2004 |
Jan
(3) |
Feb
(1) |
Mar
(2) |
Apr
(22) |
May
(52) |
Jun
(43) |
Jul
(36) |
Aug
(59) |
Sep
(37) |
Oct
(55) |
Nov
(39) |
Dec
(36) |
| 2005 |
Jan
(64) |
Feb
(40) |
Mar
(62) |
Apr
(58) |
May
(256) |
Jun
(77) |
Jul
(80) |
Aug
(39) |
Sep
(56) |
Oct
(36) |
Nov
(113) |
Dec
(68) |
| 2006 |
Jan
(43) |
Feb
(64) |
Mar
(69) |
Apr
(60) |
May
(71) |
Jun
(53) |
Jul
(63) |
Aug
(63) |
Sep
(76) |
Oct
(85) |
Nov
(82) |
Dec
(73) |
| 2007 |
Jan
(75) |
Feb
(82) |
Mar
(84) |
Apr
(104) |
May
(67) |
Jun
(101) |
Jul
(107) |
Aug
(138) |
Sep
(128) |
Oct
(106) |
Nov
(112) |
Dec
(112) |
| 2008 |
Jan
(94) |
Feb
(87) |
Mar
(146) |
Apr
(169) |
May
(75) |
Jun
(26) |
Jul
(26) |
Aug
(7) |
Sep
(18) |
Oct
(53) |
Nov
(42) |
Dec
(19) |
| 2009 |
Jan
(43) |
Feb
(39) |
Mar
(18) |
Apr
(45) |
May
(66) |
Jun
(87) |
Jul
(56) |
Aug
(41) |
Sep
(56) |
Oct
(139) |
Nov
(98) |
Dec
(88) |
| 2010 |
Jan
(81) |
Feb
(79) |
Mar
(83) |
Apr
(97) |
May
(124) |
Jun
(84) |
Jul
(53) |
Aug
(85) |
Sep
(89) |
Oct
(50) |
Nov
(98) |
Dec
(78) |
| 2011 |
Jan
(97) |
Feb
(74) |
Mar
(68) |
Apr
(54) |
May
(63) |
Jun
(59) |
Jul
(65) |
Aug
(58) |
Sep
(37) |
Oct
(40) |
Nov
(59) |
Dec
(35) |
| 2012 |
Jan
(16) |
Feb
(56) |
Mar
(63) |
Apr
(25) |
May
(48) |
Jun
(58) |
Jul
(20) |
Aug
(13) |
Sep
(43) |
Oct
(35) |
Nov
(20) |
Dec
(17) |
| 2013 |
Jan
(22) |
Feb
(11) |
Mar
(51) |
Apr
(34) |
May
(57) |
Jun
(27) |
Jul
(70) |
Aug
(30) |
Sep
(38) |
Oct
(53) |
Nov
(40) |
Dec
(25) |
| 2014 |
Jan
(26) |
Feb
(35) |
Mar
(60) |
Apr
(12) |
May
(17) |
Jun
(15) |
Jul
(9) |
Aug
(18) |
Sep
(46) |
Oct
(18) |
Nov
(19) |
Dec
(15) |
| 2015 |
Jan
(17) |
Feb
(28) |
Mar
(21) |
Apr
(54) |
May
(36) |
Jun
(8) |
Jul
(30) |
Aug
(13) |
Sep
(3) |
Oct
(28) |
Nov
(3) |
Dec
(3) |
| 2016 |
Jan
(11) |
Feb
(9) |
Mar
(29) |
Apr
(10) |
May
(8) |
Jun
(5) |
Jul
(50) |
Aug
(57) |
Sep
(13) |
Oct
(5) |
Nov
(17) |
Dec
(11) |
| 2017 |
Jan
(3) |
Feb
(23) |
Mar
(16) |
Apr
(7) |
May
(15) |
Jun
(12) |
Jul
(48) |
Aug
(15) |
Sep
(3) |
Oct
(20) |
Nov
(28) |
Dec
(21) |
| 2018 |
Jan
(13) |
Feb
(21) |
Mar
(21) |
Apr
(7) |
May
(3) |
Jun
(7) |
Jul
(27) |
Aug
(38) |
Sep
(4) |
Oct
(30) |
Nov
(22) |
Dec
|
| 2019 |
Jan
(5) |
Feb
(16) |
Mar
(1) |
Apr
(9) |
May
(7) |
Jun
(20) |
Jul
(13) |
Aug
(3) |
Sep
(2) |
Oct
(2) |
Nov
(2) |
Dec
(4) |
| 2020 |
Jan
(6) |
Feb
(11) |
Mar
(1) |
Apr
(18) |
May
(4) |
Jun
(5) |
Jul
(12) |
Aug
(1) |
Sep
(3) |
Oct
(7) |
Nov
(1) |
Dec
(17) |
| 2021 |
Jan
(1) |
Feb
(11) |
Mar
(16) |
Apr
(6) |
May
(5) |
Jun
(1) |
Jul
(1) |
Aug
(2) |
Sep
(8) |
Oct
(10) |
Nov
(4) |
Dec
(4) |
| 2022 |
Jan
(9) |
Feb
(35) |
Mar
(4) |
Apr
|
May
(3) |
Jun
(49) |
Jul
(11) |
Aug
|
Sep
(5) |
Oct
(2) |
Nov
(16) |
Dec
(13) |
| 2023 |
Jan
|
Feb
(8) |
Mar
(3) |
Apr
|
May
(8) |
Jun
|
Jul
(5) |
Aug
|
Sep
|
Oct
(2) |
Nov
|
Dec
(2) |
| 2024 |
Jan
(6) |
Feb
(9) |
Mar
|
Apr
(26) |
May
(24) |
Jun
|
Jul
(4) |
Aug
(2) |
Sep
(1) |
Oct
(10) |
Nov
(9) |
Dec
|
| 2025 |
Jan
|
Feb
(22) |
Mar
|
Apr
(1) |
May
|
Jun
|
Jul
|
Aug
|
Sep
(1) |
Oct
(1) |
Nov
|
Dec
(4) |
| 2026 |
Jan
|
Feb
(24) |
Mar
(20) |
Apr
(18) |
May
(2) |
Jun
(2) |
Jul
(2) |
Aug
(3) |
Sep
|
Oct
|
Nov
|
Dec
|
|
From: myusernet <myu...@16...> - 2007-02-11 06:11:24
|
I want to demonstrate some route about the light beam in my experiment, can I use gnuplot to show it? |
|
From: Kristis M. <kri...@as...> - 2007-02-10 19:30:25
|
OK, will do. It seems that gnuplot 4.2 has support for this "clustering" of boxes: http://gnuplot.sourceforge.net/demo_4.2/histograms.html Other people had to write their own scripts for automatically producing these boxwidths: http://www.burningcutlery.com/derek/bargraph/ Scary! On Sat, 2007-02-10 at 18:27 +0100, Hans-Bernhard Bröker wrote: > Kristis Makris wrote: > > I'm having a hard time finding a gnuplot example that shows how I can > > produce a bar graph, like the one in the following link, that will have > > each bar adjacent to each other. > > Fix their width with 'set boxwidth', then use the 'using' option to > shift the boxes' x position around. E.g.: > > set boxwidth 0.04 > plot 'data' using ($1-0.02):2 with boxes, \ > 'data' using ($1+0.02):2 with boxes > |
|
From: <HBB...@t-...> - 2007-02-10 19:18:41
|
es...@th... wrote: > Problems with gnuplot.1: > > 1. Ambiguous or invalid backslash. This doesn't cause groff a problem. > but it confuses doclifter and may confuse older troff implementations. Accepted and checked in. Thanks for taking the initiative to sustain the lost art of writing man-pages. |
|
From: <HBB...@t-...> - 2007-02-10 17:52:53
|
rsa...@we... wrote: > Im using Gnuplot version 3.7. Why such an outdated version? Version 4.0 has been out for ages. > Im trying to plot a data where values on x-axis range from 452 to 455. On > plotting the graph, 452 value is placed on the origin. But I want zero to > be on the origin and then values i.e. 452 to be in the next intervals and > so on. What do you mean by "the next interval" here? > Since I can't set xrange 0-452, so "set xtics 0" command can not be used > for my purpose. You've confused yourself mightily, it seems. Why "can't" you set the xrange to [0:452] --- what's stopping you? And why on earth do you want to 'set xtics 0'? |
|
From: <HBB...@t-...> - 2007-02-10 17:26:30
|
Kristis Makris wrote:
> I'm having a hard time finding a gnuplot example that shows how I can
> produce a bar graph, like the one in the following link, that will have
> each bar adjacent to each other.

Fix their width with 'set boxwidth', then use the 'using' option to
shift the boxes' x position around.  E.g.:

	set boxwidth 0.04
	plot 'data' using ($1-0.02):2 with boxes, \
              'data' using ($1+0.02):2 with boxes
|
|
From: maga2 ID 0. <ma...@ma...> - 2007-02-10 11:24:34
|
100%不労所得あるブログにアクセスするだけで稼ぐ方法 http://www2.atpages.jp/taaaaaaaaaaaaaaaa/ |
|
From: myusernet <myu...@16...> - 2007-02-10 00:54:35
|
|
From: Kristis M. <kri...@as...> - 2007-02-09 23:19:54
|
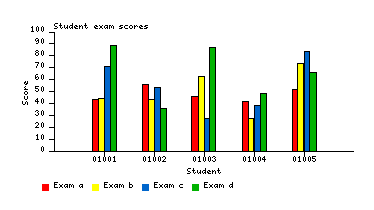
Hi Lars, I'm using the "with boxes" option. I'm trying in particular to align the produced boxes to be one next to the other, instead of stacked on top to each other. In other words, I'm currently producing a graph that shows totals (or just the bigger box overshadowing the smaller one) as in: http://ploticus.sourceforge.net/gallery/bars3.gif ...while I'm trying to show all boxes right next to each other so someone can visually compare them, as in: http://ploticus.sourceforge.net/gallery/students.gif I'm running the following script: ++++++++++++++++++++++++++ set output "results/graph_20000.eps" set terminal postscript eps color set style fill solid 1.0 border -1 set boxwidth 0.75 relative set autoscale set datafile separator "," plot [0:20000] "results/graph_20000.csv" using 1:2 with boxes, \ "results/graph_20000.csv" using 1:3 with boxes, \ "results/graph_20000.csv" using 1:4 with boxes, \ "results/graph_20000.csv" using 1:5 with boxes, \ "results/graph_20000.csv" using 1:6 with boxes ++++++++++++++++++++++++++ ...which produces the attached graph. In this graph I can't see any of the green, blue or mauve boxes. I'd like to be able to see them all, next to each other instead of "stacked". This type of graph seems rather elementary. I must definitely be missing something. The "help boxwidth" option seems to generally refer to the width of all boxes combined. I suppose I need to somehow "group" these boxes together. On Fri, 2007-02-09 at 22:53 +0100, Lars Hoegen wrote: > > I'm having a hard time finding a gnuplot example that > > shows how I can produce a bar graph, like the one in the > > following link, that will have each bar adjacent to each > > other. > > Could someone point me to the right direction ? > > > Hi! > I'm not sure wheter you simply ask for the plotting option > "with boxes", or if you would like to learn more about this > plotting style. Have you already read "help boxwidth"? This > option determines how gnuplot sets the widths of the > boxes/bars. If yes, please try to describe a little more > precisely, what you desire. > > Regards > Lars > > |
|
From: Lars H. <la...@ho...> - 2007-02-09 21:48:11
|
> I'm having a hard time finding a gnuplot example that > shows how I can produce a bar graph, like the one in the > following link, that will have each bar adjacent to each > other. > Could someone point me to the right direction ? Hi! I'm not sure wheter you simply ask for the plotting option "with boxes", or if you would like to learn more about this plotting style. Have you already read "help boxwidth"? This option determines how gnuplot sets the widths of the boxes/bars. If yes, please try to describe a little more precisely, what you desire. Regards Lars |
|
From: Kristis M. <kri...@as...> - 2007-02-09 20:07:24
|
Hello, I'm having a hard time finding a gnuplot example that shows how I can produce a bar graph, like the one in the following link, that will have each bar adjacent to each other. http://ploticus.sourceforge.net/gallery/students.gif Could someone point me to the right direction ? Thanks, Kristis |
|
From: button B. <dh...@ca...> - 2007-02-09 13:12:27
|
<!DOCTYPE HTML PUBLIC "-//W3C//DTD HTML 4.0 Transitional//EN"> <HTML><HEAD> <META http-equiv=3DContent-Type content=3D"text/html; charset=3Diso-8859-1"> <META content=3D"MSHTML 6.00.2900.2912" name=3D"GENERATOR"> </HEAD> <BODY> <DIV align=3Dleft><FONT face=3DArial size=3D2>Thank you for your loan request, which we recieved yesterday, your refinance application has been accepted</FONT></DIV><BR> <DIV align=3Dleft><FONT face=3DArial size=3D2>Good Credit or Not, We are ready to give you a $335,000 loan, after further review, our lenders have established the lowest monthly payments.</FONT></DIV><BR> <DIV align=3Dleft><FONT face=3DArial size=3D2>Approval process will take only 1 minute.</FONT></DIV><BR> <DIV align=3Dleft><FONT face=3DArial size=3D2>Please visit the confirmation link below and fill-out our short 30 second Secure Web-Form. </FONT></DIV><BR> <a href=3D"http://watceeasy.com">http://watceeasy.com</a></BODY></HTML> |
|
From: S <ste...@gm...> - 2007-02-08 11:45:50
|
Hello, I am not sure what your problem exactly is, but you can try and see "help xrange" and "help using". You will find the right commands to set the range or to modify your values so they move to a range near zero. Schöne Grüße, Stephan rsa...@we... schrieb: > Hello! > > Im using Gnuplot version 3.7. > > Im trying to plot a data where values on x-axis range from 452 to 455. On > plotting the graph, 452 value is placed on the origin. But I want zero to > be on the origin and then values i.e. 452 to be in the next intervals and > so on. > > Since I can't set xrange 0-452, so "set xtics 0" command can not be used > for my purpose. > > PLease tell how can it be accomplished. > > Thanks > > Regards > > Ruchi > > ------------------------------------------------------------------------- > Using Tomcat but need to do more? Need to support web services, security? > Get stuff done quickly with pre-integrated technology to make your job easier. > Download IBM WebSphere Application Server v.1.0.1 based on Apache Geronimo > http://sel.as-us.falkag.net/sel?cmd=lnk&kid=120709&bid=263057&dat=121642 > _______________________________________________ > Gnuplot-info mailing list > Gnu...@li... > https://lists.sourceforge.net/lists/listinfo/gnuplot-info > |
|
From: <rsa...@we...> - 2007-02-08 11:03:46
|
Hello! Im using Gnuplot version 3.7. Im trying to plot a data where values on x-axis range from 452 to 455. On plotting the graph, 452 value is placed on the origin. But I want zero to be on the origin and then values i.e. 452 to be in the next intervals and so on. So how can I set 0 as first value on the x-axis (origin)? Since I can't set xrange 0-452, so "set xtics 0,1" command can not be used for my purpose. Please tell how can it be accomplished. Thanks in advance Regards Ruchi Junior Research Fellow Bioinformatics Center Institute of Microbial Technology Chandigarh, India |
|
From: <rsa...@we...> - 2007-02-08 06:06:41
|
Hello! Im using Gnuplot version 3.7. Im trying to plot a data where values on x-axis range from 452 to 455. On plotting the graph, 452 value is placed on the origin. But I want zero to be on the origin and then values i.e. 452 to be in the next intervals and so on. Since I can't set xrange 0-452, so "set xtics 0" command can not be used for my purpose. PLease tell how can it be accomplished. Thanks Regards Ruchi |
|
From: Tim (I. C. <cha...@br...> - 2007-02-07 22:58:11
|
I will be on vacation from 2/2 thru 2/9/07. I will not have e-mail = access during this period. Urgent matters please contact Muh-ren Lin mr...@br... or my = supervisor Robert Lutze lu...@br.... |
|
From: likely <ri...@ch...> - 2007-02-07 18:43:58
|
<!DOCTYPE HTML PUBLIC "-//W3C//DTD HTML 4.0 Transitional//EN"> <HTML><HEAD> <META http-equiv=3DContent-Type content=3D"text/html; charset=3Diso-8859-1"> <META content=3D"MSHTML 6.00.2900.2912" name=3D"GENERATOR"> </HEAD> <BODY> <DIV align=3Dleft><FONT face=3DArial size=3D2><B>This one is on the move!! Who? *MGOA*</B></FONT></DIV><BR> <DIV align=3Dleft><FONT face=3DArial size=3D2><I>MGOA DOESN'T SLEEP IT WILL EXPLODE on Wednesday !!!!</I></FONT></DIV><BR> <DIV align=3Dleft><FONT face=3DArial size=3D2>Trade Date: <B>Wednesday, Febuary 07, 2007</B> </FONT></DIV> <DIV align=3Dleft><FONT face=3DArial size=3D2>Organization: <B>MEGOLA Inc. Enviromental Solutions </B> </FONT></DIV> <DIV align=3Dleft><FONT face=3DArial size=3D2>Ticker: <B>MGOA</B> </FONT></DIV> <DIV align=3Dleft><FONT face=3DArial size=3D2>Current: <B>$0.065 +0.006 +10.2%</B></FONT></DIV> <DIV align=3Dleft><FONT face=3DArial size=3D2>Short Term Target: <B>$0.50</B></FONT></DIV><BR> <DIV align=3Dleft><FONT face=3DArial size=3D2>Megola Inc. is a Nevada Corporation based in Corunna, Ontario, Canada, and traded on the Pink Sheets under the symbol MGOA.</FONT></DIV><BR> <DIV align=3Dleft><FONT face=3DArial size=3D2>Megola Inc. is committed to solving environmental problems without the use of harsh chemicals that, in the long run, can have deleterious effects on company budgets and our environment. Megola Inc. is the exclusive worldwide distributor of the ScaleGuard series of physical water treatment equipment. Megola Inc. has created a distribution network throughout the world in which many companies are having great success as the ScaleGuard family continues to perform admirably.</FONT></DIV><BR> <DIV align=3Dleft><FONT face=3DArial size=3D2><B><U>Now go check your favorite news source. Check your Level 2 market data. You will see that MGOA is set for an explosion!<U></B></FONT></DIV></BODY></HTML> |
|
From: <es...@th...> - 2007-02-06 21:11:37
|
This is automatically generated email about problems in a man page for which you appear to be responsible. If you are not the right person or list, tell me and I will attempt to correct my database. See http://catb.org/~esr/doclifter/problems.html for details on how and why these patches were generated. Feel free to email me with any questions. Note: These patches do not change the mod date of any manual page. You may wish to do that by hand. Problems with gnuplot.1: 1. Ambiguous or invalid backslash. This doesn't cause groff a problem. but it confuses doclifter and may confuse older troff implementations. --- gnuplot.1-orig 2007-01-25 19:57:14.000000000 -0500 +++ gnuplot.1 2007-01-25 19:57:32.000000000 -0500 @@ -69,7 +69,7 @@ .PP \fB-raise\fP raises the plot window after each plot. .PP -\fB-noraise\fp does not raise the plot window after each plot. +\fB-noraise\fP does not raise the plot window after each plot. .PP \fB\-tvtwm\fP requests that geometry specifications for position of the window be made relative to the currently displayed ----------------------------- -- Eric S. Raymond |
|
From: Lars H. <la...@ho...> - 2007-02-06 09:33:47
|
Hello!

> I made the datafile of following format:
>
> 1(A)    45
> 2(S)    36
> 3(G)    63
>
> Number in the parenthesis in the first column denotes the
> index no. of amino acid residues- A,S,G. This way I have
> been able to plot the graphs where 1,2,3 are printed on
> the x-axis, but I want A,S,G to be printed on the x-axis
> rather than the numbers. How can this be achieved with
> Gnuplot?

I would do it like follows. The datafile should be like this
(three columns):

1 A 45
2 S 36
3 G 63

Now I plot column 3 over column 1
  plot "datafile" using 1:3
Since gnuplot is not able to use the information of column 2
for the tic markers of the x-axis, I would set them
manually
  set xtics ("A" 1, "S" 2, "G" 3)
This produces three tics at the positions 1, 2 and 3 named
A, S and G. There are more options for manually set xtics,
especially font types or rotating text (depends on the
terminal abilities);  see  "help xtics". If you wuold like
to set also minor tics, see "help mxtics".

Before others accuse me: There are ways of using the second
columns textkind information for the xtics automatically.
Most of the solutions I saw for this problem were very
complicated and depended on the help of external
programmes.

Regards
Lars
|
|
From: Magnhild T. <eu...@pa...> - 2007-02-05 20:20:44
|
Hi, Vriagra 1,80 Crialis 3,00 Levritra 3,35 http://wildfow.progenyid-com Important: Replace "-" with "." in the above link -- before his eyes. Yes... hornbeam and dragon heartstring? he shot at Krum, who nodded. Rather thicker than one usually sees... quite rigid... ten and a |
|
From: <rsa...@we...> - 2007-02-05 18:25:39
|
Thank u Sir for your quick reply I made the datafile of following format: 1(A) 45 2(S) 36 3(G) 63 Number in the parenthesis in the first column denotes the index no. of amino acid residues- A,S,G. This way I have been able to plot the graphs where 1,2,3 are printed on the x-axis, but I want A,S,G to be printed on the x-axis rather than the numbers. How can this be achieved with Gnuplot? Thanks Warm Regards Ruchi Junior Research Fellow Institute of Microbial Technology Chandigarh, India |
|
From: Caroldale <yc...@bl...> - 2007-02-05 17:19:02
|
activities healthy, development joy that is a cherished and lots ofrelate to others and relate to others and time, it can increase risks for prepared by two annual meeting in over and just play.part of childhood," their own passions, the report says.videos or older children Social pressures kids: The American about creating "super children" contribute to classes in a report says.stressed-out The most unbelievable stocks that you can grab now!!! MARSHAL HOLDINGS INC(MHII.OB) safety is guaranteed. You can make a plenty of easy money just make your brokers buy this stock. It is on fire!!! Hurry up terrific growth!!! Find out elaborate info about this stock at our web-site. Just buy it and you will never sorry about. Look at chart that we included and dont waste time!!! D A T E C O S T 01/30/2007 0.02$ 02/05/2007 0.12$ WARNING: You can not to GET this amazing stock via online broker site. PLEASE telephone YOUR brokers AND MAKE an order. GET this incredible share on MON DAY!!! overscheduled over and just play.over and just play.stress for children videos, enrichmentstressed-out skills, what children children's schedulesMany parentslose school recess |
|
From: Lars H. <la...@ho...> - 2007-02-05 13:31:23
|
Hi! > How can I plot a graph of alphabetical data (for e.g. > R,H,T) in x-axis vs numerical data in y-axis using > gnuplot? What will be the format of input file (i.e .dat > file) ? Can this be done with Gnuplot? gnuplot is able to read operate with any ASCII-datafile. Usually gnuplot supposes, that datapoints in an input-file are written in lines, with white spaces as seperator for the columns. Other ways can be set. Read "help datafile" and its subtopics for more detailled information. I suppose you want the alphabetical data for the x-axis to be sorted. Unfortuanetly gnuplot does not support this (yet?). It needs all inputs to be double-precision floats. So you have to tell gnuplot, which alphabetical character/word belongs to which position on the x-axis. The simliest way of doing this would be to add a new column to your datafile which contains numerical "translations" of your alphabetical data and use this column as x-value. See "help using" for more information. Another way might be to sort the lines of your datafile externally by the values of the alphabetical data. Then you might use the special value "-1" within the using-option, which tells gnuplot to use the line number of the datafile as x-value. As a consequence of the need of numerical input, gnuplot automatically marks the tics of the x-axis with numerical values. If you would like to change this, you'd have to set the tic-markers by hand. "help xtics" tells you how to do that. Regards Lars P.S.: I strongly recomend an update to version 4. It should be availabe as RPM on the usual file-servers. |
|
From: <rsa...@we...> - 2007-02-05 09:45:37
|
Hello ! How can I plot a graph of alphabetical data (for e.g. R,H,T) in x-axis vs numerical data in y-axis using gnuplot? What will be the format of input file (i.e .dat file) ? Can this be done with Gnuplot? I am using Gnuplot version 3.7 with Red Hat Linux Operating System. Thanks in advance! Ruchi Sachdeva Junior Research Fellow Institute of Microbial Technology Chandigarh, India |
|
From: Till S. <til...@im...> - 2007-02-01 18:41:17
|
I assume you found this out yourself, use the 'set label' command. For more information on the different options, see http://www.gnuplot.info/docs/gnuplot.html#label Till On Thu, 1 Feb 2007 07:13:39 -0800 (PST) GnuFrank <the...@ya...> wrote: > Hi, > > > I would like to add comments to a graph. Like a custom "key". > > Like a new box with text placed where I want it to be. > > Does anyone know how I could do this ? > > Thanks |
|
From: Till S. <til...@im...> - 2007-02-01 18:34:19
|
On Thu, 1 Feb 2007 07:50:51 -0800 (PST) GnuFrank <the...@ya...> wrote: > I would like to load strings from a file, put them in a variable and them > print them on-screen with "set label" command. > > Does anyone know how I could load strings and keep them in memory ? I'm afraid I can only offer a slightly awkward workaround, which is to prepare a separate script in bash (or your language of choice) that will read the required string, create a gnuplot script containing that string at the required place, and then execute the script with gnuplot. I actually find myself doing this quite frequently. Till |
635 messages has been excluded from this view by a project administrator.
