Business LOG

Business LOG

Enterprise Informatic Solutions
+
+

Related Products

  • AdRem NetCrunch
    165 Ratings
    Visit Website
  • SuperOps
    223 Ratings
    Visit Website
  • Freshservice
    2,139 Ratings
    Visit Website
  • NinjaOne
    6,033 Ratings
    Visit Website
  • ManageEngine EventLog Analyzer
    211 Ratings
    Visit Website
  • Setyl
    48 Ratings
    Visit Website
  • EZO AssetSonar
    118 Ratings
    Visit Website
  • Grafana Cloud
    859 Ratings
    Visit Website
  • UnForm
    19 Ratings
    Visit Website
  • ManageEngine Log360
    190 Ratings
    Visit Website

About

With over 11,000 installations Business LOG is the most requested tool by companies looking for a flexible and efficient log management suite. Available in “On-Premise” or “SaaS” Versions, with Agent Methods and Log Collection Agent less. Business LOG provides complete log analysis, reports and alerts, a powerful log search engine and a flexible log storage option.

About

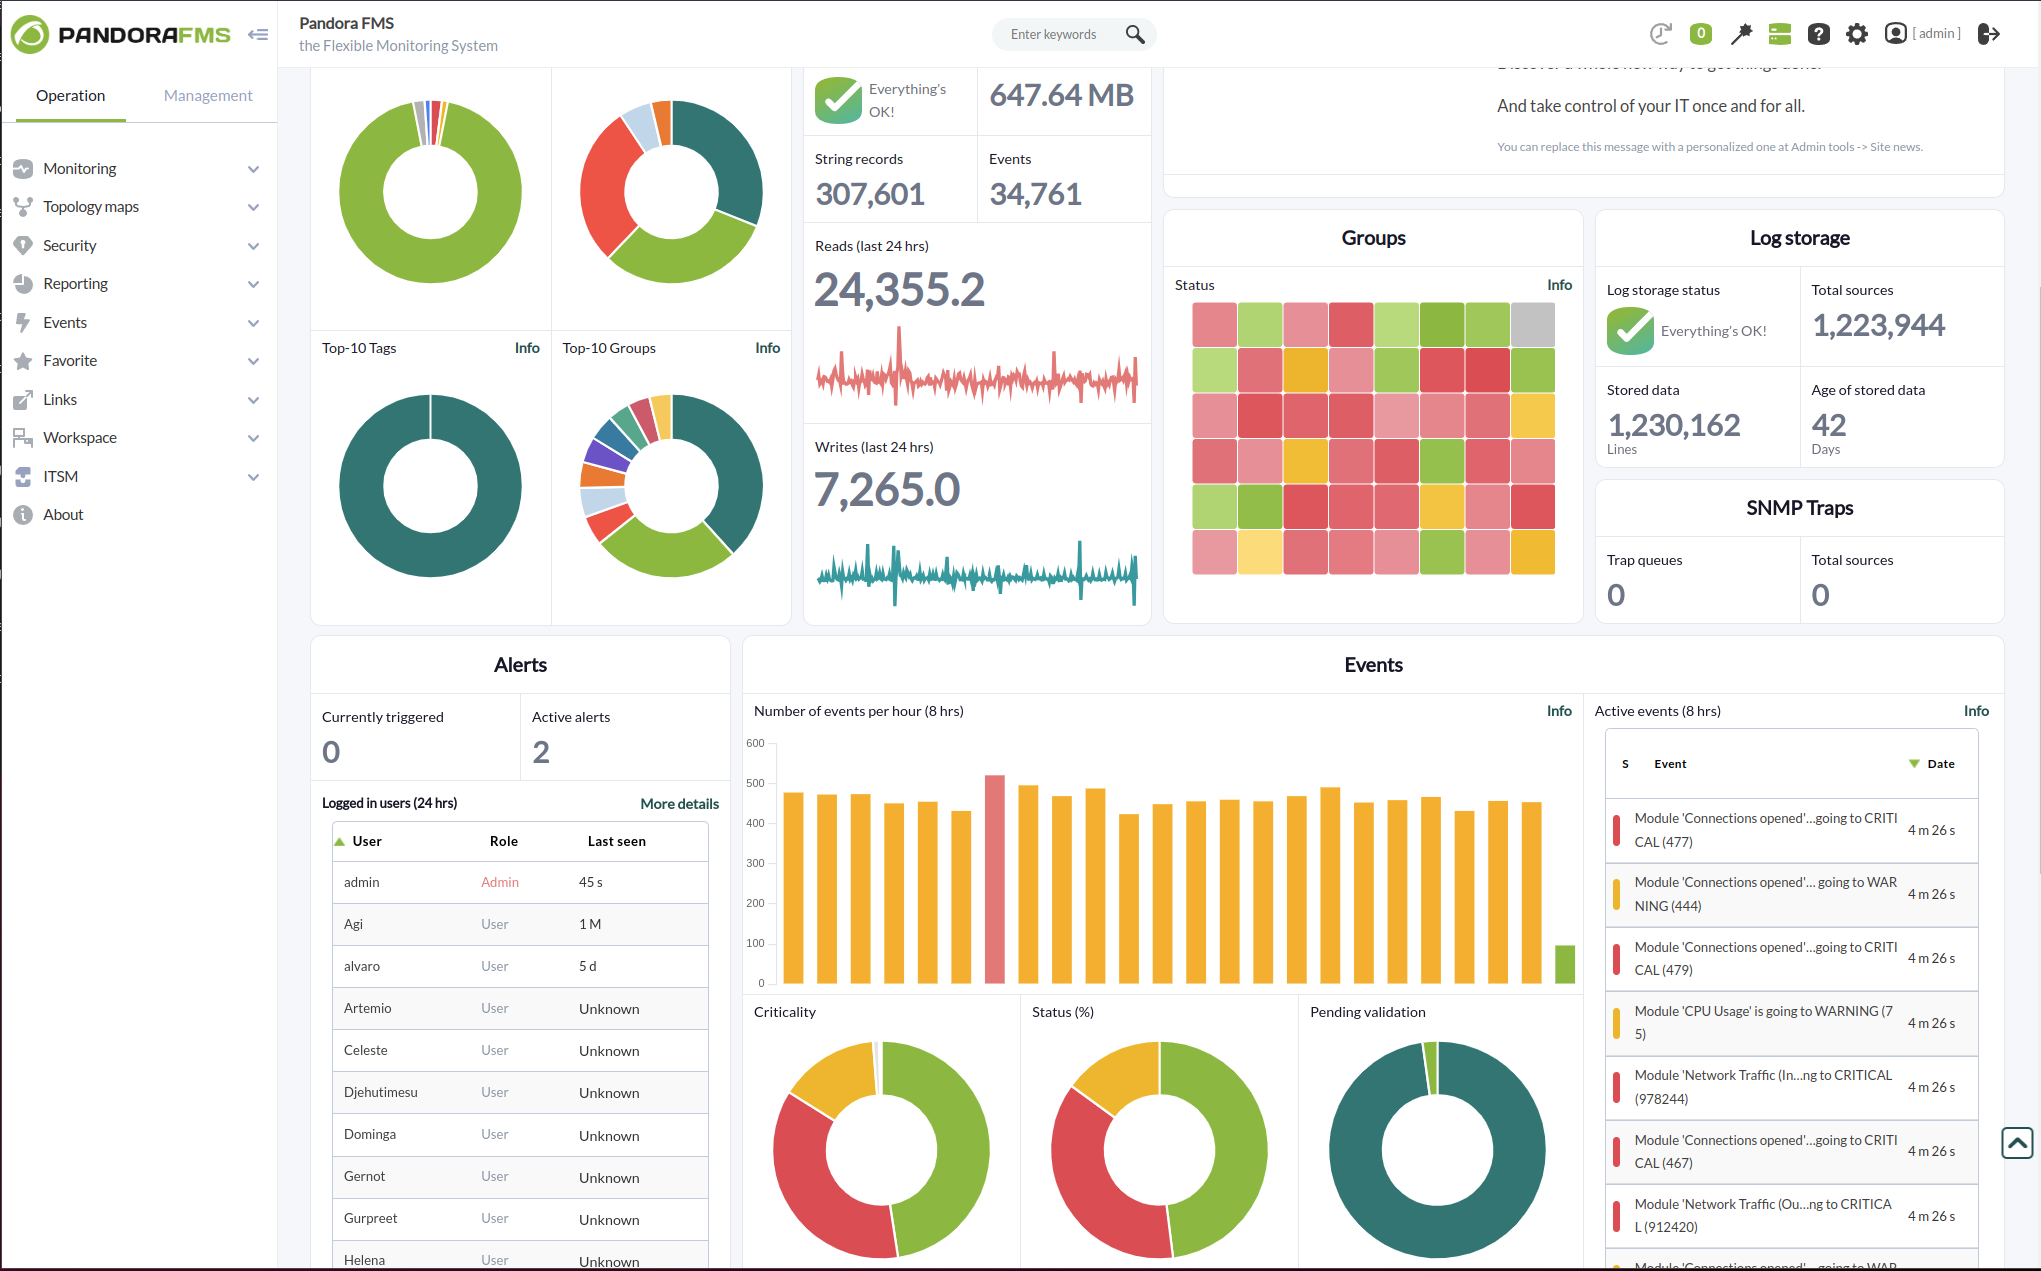
With more than 50,000 customer installations across the five continents, Pandora FMS is a truly all-in-one monitoring solution, covering all traditional silos for specific monitoring: servers, networks, applications, logs, synthetic/transactional, remote control, inventory, etc. Pandora FMS gives you the agility to find and solve problems quickly, scaling them so they can be derived from any source, on-premise, multi cloud or both of them mixed. Now you have that capability across your entire IT stack and analytics to find any problem, even the ones that are hard to find. Thanks to more than 500 plugins available, you can control and manage any application and technology, from SAP, Oracle, Lotus, Citrix or Jboss to VMware, AWS, SQL Server, Redhat, Websphere, etc.

Platforms Supported

Windows
Mac
Linux
Cloud
On-Premises
iPhone
iPad
Android
Chromebook

Platforms Supported

Windows
Mac
Linux
Cloud
On-Premises
iPhone
iPad
Android
Chromebook

Audience

Businesses interested in a powerful log management suite

Audience

All kind of IT environments, from just a few to several thousand devices

Support

Phone Support
24/7 Live Support
Online

Support

Phone Support
24/7 Live Support
Online

API

Offers API

API

Offers API

Screenshots and Videos

Screenshots and Videos

Pricing

No information available.
Free Version
Free Trial

Pricing

€90/month
On-premise, SaaS and subscription models available.
Free Version
Free Trial

Reviews/Ratings

Overall 5.0 / 5
ease 4.8 / 5
features 5.0 / 5
design 4.7 / 5
support 5.0 / 5

Reviews/Ratings

Overall 4.8 / 5
ease 4.5 / 5
features 4.5 / 5
design 4.4 / 5
support 4.6 / 5

Pros & Cons from Real Users

Pros

  • Lot of reports. Easy to analyze data. Alarms and notification. Health status of every host monitored. Support Windows\Syslog\Linux\Mac.
  • I appreciate the completeness of the product, its extreme reliability and the high possibility of customization.
  • Full, intuitive, reliable. The software captures logs from all devices and allows immediate viewing and has many utilities inside.
  • Agentless log capture. Software inventory. Super-fast filters. Exports in various formats. Compliance with privacy regulations.
  • Easy of use and a large number of very useful functions. Installation was simple and everything worked perfectly. Advice for all companies.

Cons

  • Depending on the environment, it could take a bit to configure it.. but once done.. no problem!
  • The product does not report any problems or complications.
  • The graphic aspect is very simple perhaps too much: however understandable.
  • Maybe I would have appreciated being able to install it on a linux machine, you need a win2012 or higher operating system.
  • I was fine with all the features, nothing in particular bad.

Pros & Cons from Real Users

Pros

  • The Pandora FMS's best quality is its versatility. It can be used to monitor any type of device, including computers and cloud setup. The system's monitoring and alerting features can also be fully adjusted to meet our particular needs. Additionally, Pandora FMS has a comprehensive dashboard that makes it easy to use and understand, enabling us to quickly set up. The high uptime and quick response times, it also has a strong reliability.
  • Pandora FMS helps to improve the way in which various business networks are inspected and monitored, the main positive aspect of this platform is in relation to its excellent monitoring of network services, the complete platform in this regard, since it provides a panel quite complete and very well managed where the various data of the networks can be reflected, you can configure the routing, configure the Subnet mask and you can also configure the sending of packets through various business networks, in addition, you can also control the latency of each one of the networks, really this complete labor network inspection section helps me understand how all the networks we use in the company are connected, I can visualize a mapping service within the platform which helps me understand the distribution of these networks also allows me to understand the health status of each routing network, controlling the sending of packets correctly. The second positive aspect of this platform is the operation in real time, this operation in real time allows failures in time within each of the networks, in addition, it offers a graphic service where you can see the upload and download of packages in each one of your networks connected to the cloud, these graphs will help you transfer packets. Pandora FMS also has an impressive alert service, which allows you to configure it so that alerts are sent depending on the latency of your networks, you can configure these alerts to be activated when there is a latency of approximately 200ms.
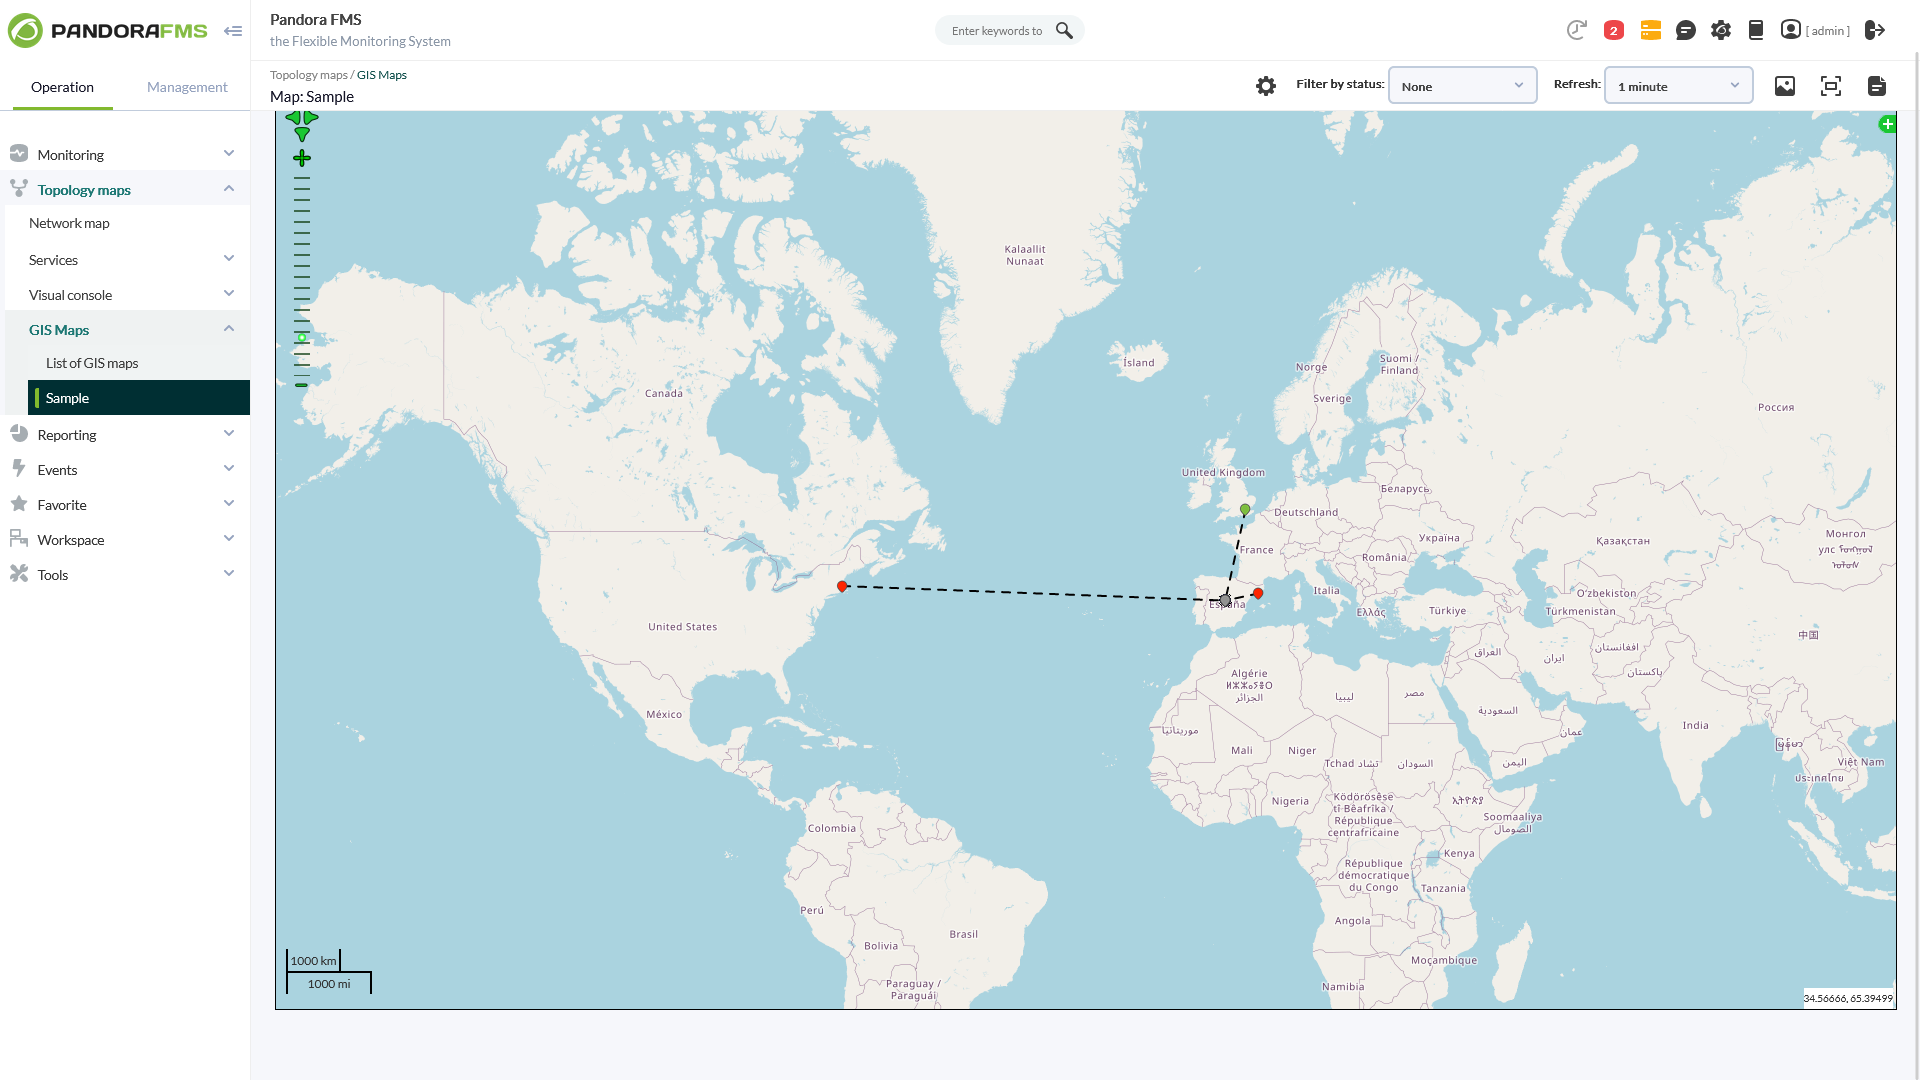
  • Pandora has been a very useful software when it comes to having constant monitoring of various services, one of the main things I liked about this platform is the widespread control that it gives me for all the business networks that we use in our company financial services, this platform allows me to know the mapping of each of our networks, I can see how all the networks are distributed through a map, which allows me to see the connectivity that our computers, our devices and the servers that we use for our company. Recognize that Network monitoring is quite complete, it allows to visualize the flow and transfer of data, it allows to detect the total number of packets lost, it allows to detect failures in the connectivity between the servers and the devices and it also allows to detect an unusual consumption in the speed of the Network. In addition, I also liked the way in which this platform allows us to know about the events that occur in all our computers, I can view all the log records in real time with the help of Pandora.
  • Very fast to set up and easy to use. Notifications are very accurate and very detailed. Once you set it up you don't have to worry about it later. Software updates are done automatically.
  • I like the abundance of information that I am able to find on the site. As well as the ease of navigation, made possible by the comprehensive menu options.

Cons

  • Setting up and configuring Pandora FMS can be difficult for larger businesses because it necessitates a certain level of expertise.
  • The first negative aspect of this platform is in relation to how complicated its implementation is, implementing this platform from scratch is quite complex, since you have to configure the enrollment networks correctly, in addition, you also have to configure the alerts and the devices connected to the networks to favor the network mapping function, this process can take a couple of weeks depending on your work team, but in general, the main implementation of this platform is quite complex. Another negative aspect of this platform is the high cost that it has, despite the fact that this platform has great accessibility to your routing networks, and allows you to control the way it offers other services such as application event monitoring, which increases Even more its price, I consider this platform to be relatively expensive compared to other network monitoring platforms.
  • The only problem that can be found within Pandora is that this platform is complicated when implementing it for the first time, since you will have to integrate the queue with different applications in which you want to have monitoring, this process can take you a couple of days, therefore, it is very necessary that a trained team is used to facilitate the main implementation process, in addition, the integration process with each of the networks, can also be a bit complex, so in general, this platform is very complex to implement.
  • We use the free version which is only limited to 100 sensors. To upgrade to 500 would cost a bit too much for our budget.
  • I didn't like the number of ads on the site. I thought they were a bit intrusive.

Training

Documentation
Webinars
Live Online
In Person

Training

Documentation
Webinars
Live Online
In Person

Company Information

Enterprise Informatic Solutions
Founded: 1991
Italy
www.businesslogmanagement.com

Company Information

Pandora FMS
Founded: 2005
Spain
pandorafms.com

Alternatives

Sematext Cloud

Sematext Cloud

Sematext Group

Alternatives

AdRem NetCrunch

AdRem NetCrunch

AdRem Software
Sematext Cloud

Sematext Cloud

Sematext Group

Categories

Categories

IT Alerting Features

Alert Noise Reduction
Alert Routing
Dynamic Notifications
Enriched Incident Context
Escalation Policies
Incident History Audit
Multi-User Alerting
Multiple Alert Types
On-Call Management
Rich HTML Email Notifications

System Monitoring Features

Alerts / Notifications
Antivirus Management
Data Backup / Recovery
Device Monitoring
Inventory Management
Patch Management
Policy-based Automation
Remote Monitoring
Reporting / Analytics
Risk Analysis
Server Monitoring
Service Configuration Management

Archiving Features

Access Control
Data Deduplication
Document Management
eDiscovery
Email Archiving
Multimedia Archiving
Retention Management
Storage Management
Version Control
Web Archiving

Data Management Features

Customer Data
Data Analysis
Data Capture
Data Integration
Data Migration
Data Quality Control
Data Security
Information Governance
Master Data Management
Match & Merge

IT Asset Management Features

Asset Tracking
Audit Management
Compliance Management
Configuration Management
Contract/License Management
Cost Tracking
Depreciation Management
Inventory Management
IT Service Management
Maintenance Management
Procurement Management
Requisition Management
Supplier Management

IT Management Features

Capacity Monitoring
Compliance Management
Event Logs
Hardware Inventory
IT Budgeting
License Management
Patch Management
Remote Access
Scheduling
Software Inventory
User Activity Monitoring

IT Alerting Features

Alert Noise Reduction
Alert Routing
Dynamic Notifications
Enriched Incident Context
Escalation Policies
Incident History Audit
Multi-User Alerting
Multiple Alert Types
On-Call Management
Rich HTML Email Notifications

System Monitoring Features

Alerts / Notifications
Antivirus Management
Data Backup / Recovery
Device Monitoring
Inventory Management
Patch Management
Policy-based Automation
Remote Monitoring
Reporting / Analytics
Risk Analysis
Server Monitoring
Service Configuration Management

Business Activity Monitoring Features

Alerts / Notifications
Business Process Management
Cross Application Analysis
Email Monitoring
Events Monitoring
KPI Monitoring
Pre-Configured Events
Reporting / Analytics
Workflow Management

Cloud Management Features

Access Control
Billing & Provisioning
Capacity Analytics
Cost Management
Demand Monitoring
Multi-Cloud Management
Performance Analytics
SLA Management
Supply Monitoring
Workflow Approval

Database Monitoring Features

Anomaly Detection
Autodiscovery
Capacity Planning
Dashboard
Dependency Tracking
Historical Trend Analysis
Multitenancy
Notifications / Alerts
Performance Monitoring
Permissions / Access Controls
Predictive Analytics
Prioritization
Query Analysis
Resource Optimization
Troubleshooting

IT Infrastructure Monitoring Features

Alerts / Notifications
Application Monitoring
Bandwidth Monitoring
Capacity Planning
Configuration Change Management
Data Movement Monitoring
Health Monitoring
Multi-Platform Support
Performance Monitoring
Point-in-Time Visibility
Reporting / Analytics
Virtual Machine Monitoring

Network Mapping Features

Color Codes / Icons
Compliance Management
Device Auto Discovery
Hierarchical Mapping
Location-Based Mapping
Map Exporting
On-Demand Mapping
Reporting/Analytics
Self-Updating Maps
Web Traffic Reporting

Network Monitoring Features

Bandwidth Monitoring
Baseline Manager
Diagnostic Tools
Internet Usage Monitoring
IP Address Monitoring
Real Time Analytics
Resource Management
Server Monitoring
SLA Monitoring
Uptime Monitoring
Web Traffic Reporting

RMM Features

Deployment Management
For MSPs
IT Asset Management
Mobile Access
Network Monitoring
Patch Management
Real-time Alerts
Remediation Management

Server Management Features

CPU Monitoring
Credential Management
Database Servers
Email Monitoring
Event Logs
History Tracking
Patch Management
Scheduling
User Activity Monitoring
Virtual Machine Monitoring

Website Monitoring Features

Availability Testing
Event Logs
Event-Based Notifications
FTP Monitoring
Mail Server Monitoring
Maintenance Scheduling
Performance Metrics
Real Time Monitoring
Transaction Monitoring
Uptime Reporting

Integrations

Akamai Cloud
Alfresco Digital Business Platform
Android
Cloud Foundry
FreeBSD
Hadoop
IBM WebSphere Application Server
Linkfire
Microsoft IIS
Nutanix AHV
OpenNebula
Oracle Exadata
RabbitMQ
Redis
Redmine
SAP HANA
SQL Server
Zammad
Zimbra

Integrations

Akamai Cloud
Alfresco Digital Business Platform
Android
Cloud Foundry
FreeBSD
Hadoop
IBM WebSphere Application Server
Linkfire
Microsoft IIS
Nutanix AHV
OpenNebula
Oracle Exadata
RabbitMQ
Redis
Redmine
SAP HANA
SQL Server
Zammad
Zimbra
Claim Business LOG and update features and information
Claim Pandora FMS and update features and information