Paessler PRTG

Paessler PRTG

Paessler GmbH
+
+

Related Products

  • AdRem NetCrunch
    158 Ratings
    Visit Website
  • Uptime.com
    478 Ratings
    Visit Website
  • Grafana Cloud
    853 Ratings
    Visit Website
  • UptimeRobot
    840 Ratings
    Visit Website
  • NinjaOne
    5,368 Ratings
    Visit Website
  • New Relic
    2,923 Ratings
    Visit Website
  • Atera
    2,094 Ratings
    Visit Website
  • Blumira
    150 Ratings
    Visit Website
  • Overmonitor
    8 Ratings
    Visit Website
  • NeuBird
    2 Ratings
    Visit Website

About

Better Stack is an eBPF-based, AI SRE observability tool that helps you ship better software, faster. Schedule on-call rotations, receive actionable alerts, and resolve incidents with ease. Better Stack brings together incident management, uptime monitoring, status pages, log management, and infrastructure monitoring – all in one place. Built for speed and scale, it combines multiple monitoring and alerting workflows into a single, powerful interface that boosts visibility and slashes response times. Key features include an OpenTelemetry-native Kubernetes collector powered by eBPF, real-time alerting, and collaborative dashboards. Under the hood, Better Stack runs on ClickHouse, enabling lightning-fast queries and scalable ingestion across high-cardinality datasets. You can visualize your entire stack, turn all your logs into structured data, and query everything with SQL – as if it were a single database. Seamlessly integrates into your workflow with 100+ integrations.

About

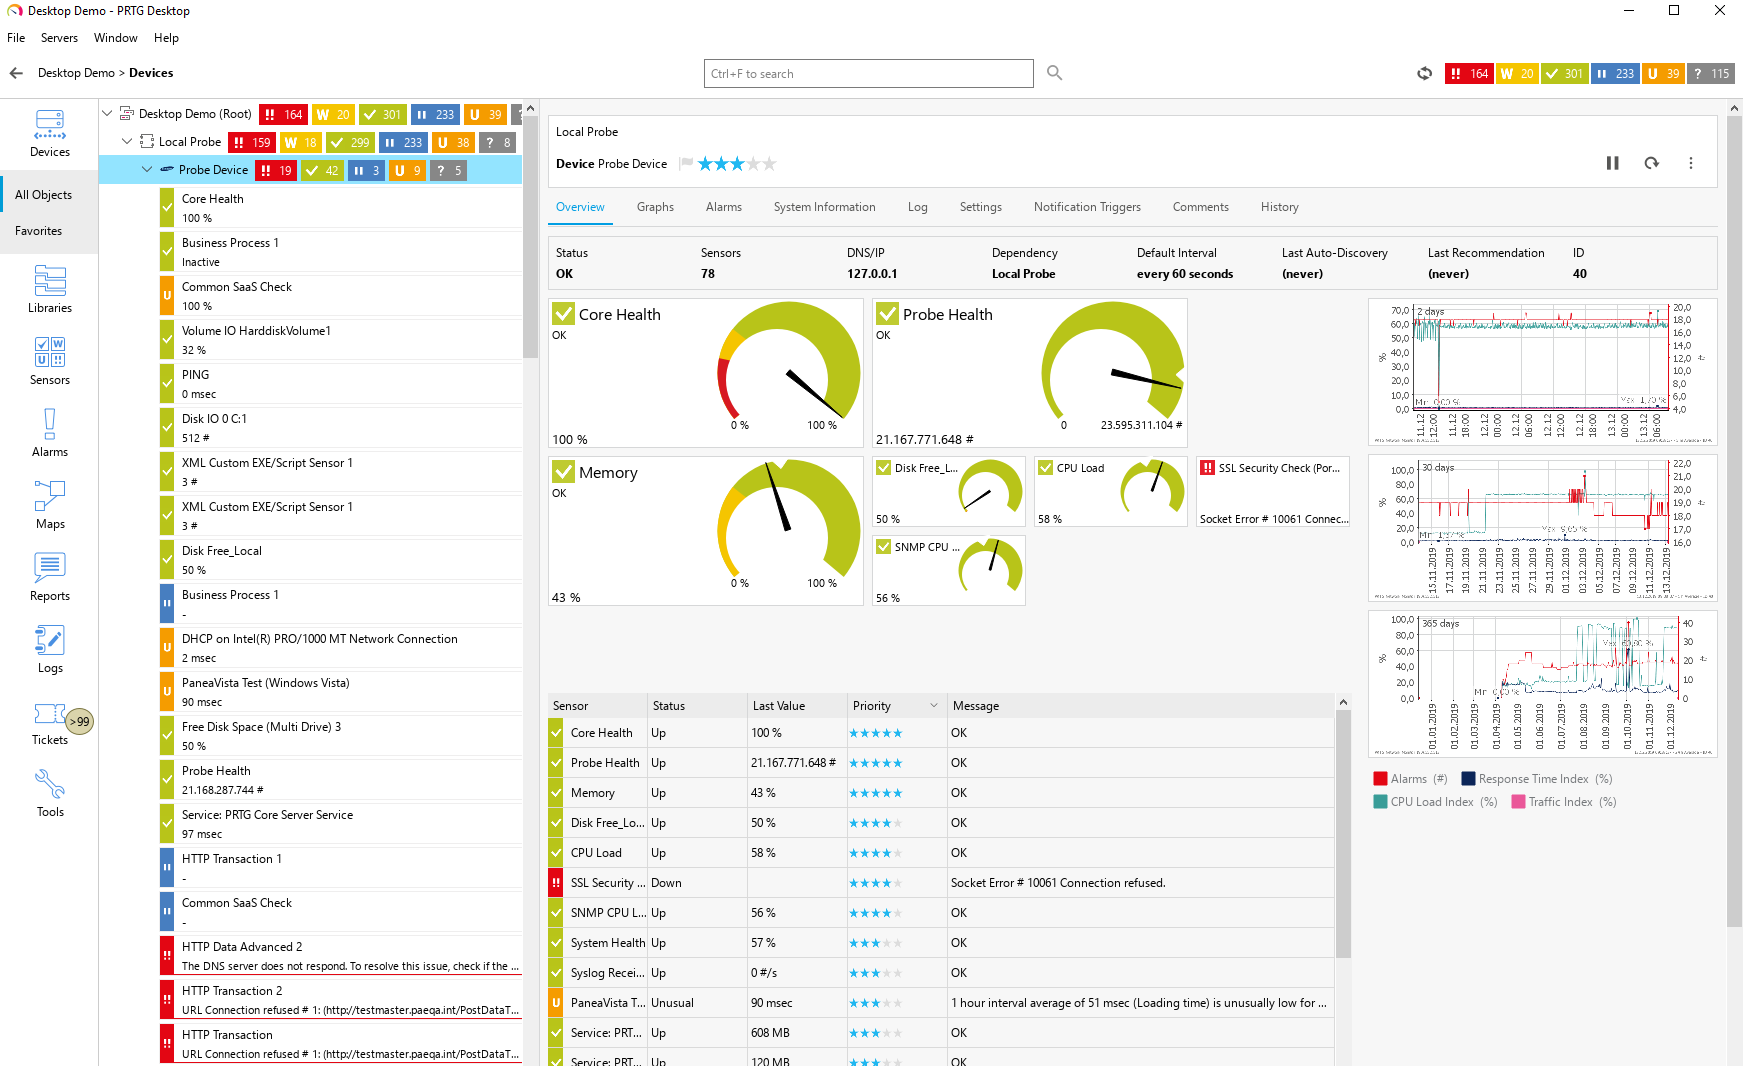
Paessler PRTG is an all-inclusive monitoring software solution developed by Paessler. Equipped with an easy-to-use, intuitive interface with a cutting-edge monitoring engine, PRTG optimizes connections and workloads as well as reduces operational costs by avoiding outages while saving time and controlling service level agreements (SLAs). The solution is packed with specialized monitoring features that include flexible alerting, cluster failover solution, distributed monitoring, in-depth reporting, maps and dashboards, and more. PRTG monitors your entire IT infrastructure. All important technologies are supported: • SNMP: ready-to-use and custom options • WMI and Windows Performance Counters • SSH: for Linux/Unix and macOS systems • Traffic analysis using flow protocols or packet sniffing • HTTP requests • REST APIs returning XML or JSON • Ping, SQL, and many more

Platforms Supported

Windows
Mac
Linux
Cloud
On-Premises
iPhone
iPad
Android
Chromebook

Platforms Supported

Windows
Mac
Linux
Cloud
On-Premises
iPhone
iPad
Android
Chromebook

Audience

Engineering teams of all sizes – from startups to Fortune 500 companies.

Audience

Caters to tech staff, system administrators, and companies of any size, from small office/home office (SOHO) to enterprises that need their IT network to be reliable and easy to monitor on a real-time basis.

Support

Phone Support
24/7 Live Support
Online

Support

Phone Support
24/7 Live Support
Online

API

Offers API

API

Offers API

Screenshots and Videos

Screenshots and Videos

Pricing

$29 per month
Try Better Stack today risk‑free with our 60‑day money-back guarantee.
Free Version
Free Trial

Pricing

$2149 for PRTG 500
PRTG 100
Free of charge
• 100 free sensors

PRTG 500- Start Small & Upgrade Later
From $2,149
500 Sensors

PRTG 1000- Small & Medium Sized Environments
From $3,899
1000 Sensors

PRTG 2500- Medium Sized Environments
From $8,099
2,500 Sensors

Best Value:
PRTG 5000- Large Environments
From $14,999
5,000 Sensors

PRTG 10000- Very Large Environments
From $17,899
10.000 Sensors

PRTG Enterprise
Custom Pricing
• Unlimited sensors
• Unlimited server installations

All pricing is based on a subscription basis.
Free Version
Free Trial

Reviews/Ratings

Overall 4.9 / 5
ease 5.0 / 5
features 4.9 / 5
design 4.3 / 5
support 5.0 / 5

Reviews/Ratings

Overall 4.8 / 5
ease 4.6 / 5
features 4.6 / 5
design 4.5 / 5
support 4.6 / 5

Pros & Cons from Real Users

Pros

  • Able to monitor my clients websites by keyword, hosting and different ways. Able to create status reports. Receive sms and phone call is a site goes down. Great UI.
  • Uptime is a reliable and complex solution for us. Great plus are the advanced escalation policies and heartbeats, checking if our background jobs get done.
  • Simple setup. Highly reliable (didn't miss a thing so far). Friendly UI, intuitive workflow. Heartbeats for CRON jobs are a great touch. Highly customizable call scheduling. Loads of integrations. Helpful and friendly support.
  • Easy to setup and use. Intuitive design and UX. Free tier is really good for being free. Checks every 3 minutes. Monitors for prescheduled tasks. Very reliable.
  • Fast and reliable incident reporting. Error screenshots and logs. Ping checks every 30 seconds. Heartbeats checking cronjobs. Customizable status pages on custom subdomains.

Cons

  • Sometimes I get notifications saying a site is down but it's not. It's a bit confusing to set up. I don't know what's happening when it gives me error code for some reason but website has not gone down.
  • I didn't really notice any big issues with the service's functionality. We'd appreciate Dark Mode, Telegram integration and some of the advanced features could be available on their lower-tier plans.
  • Status pages lack a few features, but it seems some related updates are coming soon.
  • I'm a student and payed plans are out of my reach, but no big problem with free tier.
  • I'd welcome some of the advanced features in the freelancer plan. Otherwise, not much to complain about.

Pros & Cons from Real Users

Pros

  • The interface is very intuitive and easy to configure. PRTG supports a wide variety of sensors out of the box and can monitor almost any device or service through SNMP, WMI, API, or custom scripts. The automatic network discovery saves a lot of setup time, and the alerting system is flexible and reliable.
  • Easy Installation & Setup: Quick to install, straightforward to add devices; PRTG auto-discovers sensors with minimal input required. User-Friendly Interface: Clean interface with intuitive navigation—great for beginners and power users alike. Automatic Device & Sensor Discovery: PRTG finds and sets up relevant sensors for new devices automatically, minimizing manual configuration. Customizable Dashboards & Alerts: Effective visualization tools and flexible alerting keep you informed about network health. Free Version Available: The free version (up to 100 sensors) is more than sufficient for most home and small lab setups. Versatile Monitoring: Supports a wide range of devices and protocols (SNMP, WMI, flow, etc.), covering most network needs. Active Community & Documentation: Lots of online help and documentation for troubleshooting and tips.
  • PRTG is an amazingly simple tool that helps monitor all the equipment we have in our organization. With this system, in any malfunction or crisis, we can quickly diagnose the source of the problem and solve it in an instant. We have configured all the servers and equipment in the system and it knows how to give us a quick look as soon as something happens. And that way, we can diagnose the problem quickly.
  • We've had a very positive and satisfying experience with PRTG over the years. We've been using the product for several years now, and it's proven to be the perfect solution for monitoring our network infrastructure and applications. PRTG is intuitive and well-designed, making it easy to create detailed dashboards and maps that give us a clear visual representation of the status of critical machines and services. The notification system is also very well thought out, allowing us to react quickly to any anomalies. One of PRTG’s key strengths is that it's constantly evolving, which means we regularly gain access to new sensors that we can deploy to achieve more precise and comprehensive monitoring of our systems. The user community plays an essential role as well, often helping us solve very specific sensor-related issues. On top of that, the technical support team is responsive and effective, often providing spot-on answers that help resolve complex problems. At this point, we honestly can’t imagine working without PRTG — it’s become a central part of our IT operations.
  • The number of sensor types is outstanding. Not just SNMP but a multitude of standard sensor imputs are possible as well as custom scripts in various formats. The remote probe is great for multitenant or remote sites.

Cons

  • The web interface can become slow when handling very large environments with thousands of sensors. Some advanced reporting features require manual setup, and the mobile app, while functional, could be improved for better usability.
  • Sensor Counting Can Be Confusing: Some users find the way PRTG counts “sensors” (one sensor per metric) a bit confusing, which can eat up your free limit quickly. Resource Use: The software can be resource-intensive on larger setups; may require better hardware to run smoothly if scaling up. Overwhelming Amount of Data: For home users, the sheer volume of information and settings might be daunting at first. Interface Feels Dated to Some: While functional, a few users feel the web UI could use a more modern look. Limited by Free Tier: Advanced features and larger environments may require a paid license.
  • The price is very expensive and not suitable for every organization, which is a shame. If the price were more affordable, maybe more organizations would purchase it.
  • What I like less about the software is the way lookups are managed. It could be more user-friendly — right now, you have to manually edit text files directly on the probe, which isn't very convenient. There should be a dedicated interface for this, similar to how thresholds are managed. Also, the maps feature feels a bit limited, and there's a lack of confirmation prompts when deleting items. One wrong move and you can lose everything you've built. There should be more validation steps when modifying maps, especially for deletions. Just hovering over an item and accidentally clicking the trash icon can wipe out your work in an instant…
  • Hardware Scaling of large PRTG installations is something to plan ahead for

Training

Documentation
Webinars
Live Online
In Person

Training

Documentation
Webinars
Live Online
In Person

Company Information

Better Stack
Founded: 2021
United States
betterstack.com

Company Information

Paessler GmbH
Founded: 1997
Germany
www.paessler.com

Alternatives

Overmonitor

Overmonitor

Unistellar Industries, LLC

Alternatives

Auvik

Auvik

Auvik Networks
AdRem NetCrunch

AdRem NetCrunch

AdRem Software
Statseeker

Statseeker

Techniche
Site24x7

Site24x7

ManageEngine
Site24x7

Site24x7

ManageEngine

Categories

Categories

IT Infrastructure Monitoring Features

Alerts / Notifications
Application Monitoring
Bandwidth Monitoring
Capacity Planning
Configuration Change Management
Data Movement Monitoring
Health Monitoring
Multi-Platform Support
Performance Monitoring
Point-in-Time Visibility
Reporting / Analytics
Virtual Machine Monitoring

Network Monitoring Features

Bandwidth Monitoring
Baseline Manager
Diagnostic Tools
Internet Usage Monitoring
IP Address Monitoring
Real Time Analytics
Resource Management
Server Monitoring
SLA Monitoring
Uptime Monitoring
Web Traffic Reporting

System Monitoring Features

Alerts / Notifications
Antivirus Management
Data Backup / Recovery
Device Monitoring
Inventory Management
Patch Management
Policy-based Automation
Remote Monitoring
Reporting / Analytics
Risk Analysis
Server Monitoring
Service Configuration Management

Website Monitoring Features

Availability Testing
Event Logs
Event-Based Notifications
FTP Monitoring
Mail Server Monitoring
Maintenance Scheduling
Performance Metrics
Real Time Monitoring
Transaction Monitoring
Uptime Reporting

Incident Management Features

Audit Trail
Corrective Actions (CAPA)
Disaster Recovery
Incident Reporting
IT Incident Management
OSHA Compliance
Root-Cause Diagnosis
Safety Management
Task Management
Ticket Management

IT Infrastructure Monitoring Features

Alerts / Notifications
Application Monitoring
Bandwidth Monitoring
Capacity Planning
Configuration Change Management
Data Movement Monitoring
Health Monitoring
Multi-Platform Support
Performance Monitoring
Point-in-Time Visibility
Reporting / Analytics
Virtual Machine Monitoring

Network Monitoring Features

Bandwidth Monitoring
Baseline Manager
Diagnostic Tools
Internet Usage Monitoring
IP Address Monitoring
Real Time Analytics
Resource Management
Server Monitoring
SLA Monitoring
Uptime Monitoring
Web Traffic Reporting

System Monitoring Features

Alerts / Notifications
Antivirus Management
Data Backup / Recovery
Device Monitoring
Inventory Management
Patch Management
Policy-based Automation
Remote Monitoring
Reporting / Analytics
Risk Analysis
Server Monitoring
Service Configuration Management

Website Monitoring Features

Availability Testing
Event Logs
Event-Based Notifications
FTP Monitoring
Mail Server Monitoring
Maintenance Scheduling
Performance Metrics
Real Time Monitoring
Transaction Monitoring
Uptime Reporting

Database Monitoring Features

Anomaly Detection
Autodiscovery
Capacity Planning
Dashboard
Dependency Tracking
Historical Trend Analysis
Multitenancy
Notifications / Alerts
Performance Monitoring
Permissions / Access Controls
Predictive Analytics
Prioritization
Query Analysis
Resource Optimization
Troubleshooting

VoIP Monitoring Features

Alerts / Notifications
Call Detail Record (CDR) Analysis
Call Quality Monitoring
IP SLA Monitoring
Jitter Testing
Latency Monitoring
MOS Monitoring
Packet Loss Monitoring
QoS Monitoring
Reporting / Analytics
Troubleshooting

Integrations

Active Directory
Android
AutoMonX
BackBox
Check Point IPS
Check Point Infinity
DNSWatch
Datadog
Google Cloud Platform
Grafana Cloud
Java
Logstash
MainWP
Microsoft OneDrive
New Relic
Prometheus
Qbilon
Ruby on Rails
Stackreaction
Vercel

Integrations

Active Directory
Android
AutoMonX
BackBox
Check Point IPS
Check Point Infinity
DNSWatch
Datadog
Google Cloud Platform
Grafana Cloud
Java
Logstash
MainWP
Microsoft OneDrive
New Relic
Prometheus
Qbilon
Ruby on Rails
Stackreaction
Vercel
Claim Better Stack and update features and information
Claim Paessler PRTG and update features and information