Menu
▾
▴
matplotlib-users — Discussion related to using matplotlib
You can subscribe to this list here.
| 2003 |
Jan
|
Feb
|
Mar
|
Apr
|
May
(3) |
Jun
|
Jul
|
Aug
(12) |
Sep
(12) |
Oct
(56) |
Nov
(65) |
Dec
(37) |
|---|---|---|---|---|---|---|---|---|---|---|---|---|
| 2004 |
Jan
(59) |
Feb
(78) |
Mar
(153) |
Apr
(205) |
May
(184) |
Jun
(123) |
Jul
(171) |
Aug
(156) |
Sep
(190) |
Oct
(120) |
Nov
(154) |
Dec
(223) |
| 2005 |
Jan
(184) |
Feb
(267) |
Mar
(214) |
Apr
(286) |
May
(320) |
Jun
(299) |
Jul
(348) |
Aug
(283) |
Sep
(355) |
Oct
(293) |
Nov
(232) |
Dec
(203) |
| 2006 |
Jan
(352) |
Feb
(358) |
Mar
(403) |
Apr
(313) |
May
(165) |
Jun
(281) |
Jul
(316) |
Aug
(228) |
Sep
(279) |
Oct
(243) |
Nov
(315) |
Dec
(345) |
| 2007 |
Jan
(260) |
Feb
(323) |
Mar
(340) |
Apr
(319) |
May
(290) |
Jun
(296) |
Jul
(221) |
Aug
(292) |
Sep
(242) |
Oct
(248) |
Nov
(242) |
Dec
(332) |
| 2008 |
Jan
(312) |
Feb
(359) |
Mar
(454) |
Apr
(287) |
May
(340) |
Jun
(450) |
Jul
(403) |
Aug
(324) |
Sep
(349) |
Oct
(385) |
Nov
(363) |
Dec
(437) |
| 2009 |
Jan
(500) |
Feb
(301) |
Mar
(409) |
Apr
(486) |
May
(545) |
Jun
(391) |
Jul
(518) |
Aug
(497) |
Sep
(492) |
Oct
(429) |
Nov
(357) |
Dec
(310) |
| 2010 |
Jan
(371) |
Feb
(657) |
Mar
(519) |
Apr
(432) |
May
(312) |
Jun
(416) |
Jul
(477) |
Aug
(386) |
Sep
(419) |
Oct
(435) |
Nov
(320) |
Dec
(202) |
| 2011 |
Jan
(321) |
Feb
(413) |
Mar
(299) |
Apr
(215) |
May
(284) |
Jun
(203) |
Jul
(207) |
Aug
(314) |
Sep
(321) |
Oct
(259) |
Nov
(347) |
Dec
(209) |
| 2012 |
Jan
(322) |
Feb
(414) |
Mar
(377) |
Apr
(179) |
May
(173) |
Jun
(234) |
Jul
(295) |
Aug
(239) |
Sep
(276) |
Oct
(355) |
Nov
(144) |
Dec
(108) |
| 2013 |
Jan
(170) |
Feb
(89) |
Mar
(204) |
Apr
(133) |
May
(142) |
Jun
(89) |
Jul
(160) |
Aug
(180) |
Sep
(69) |
Oct
(136) |
Nov
(83) |
Dec
(32) |
| 2014 |
Jan
(71) |
Feb
(90) |
Mar
(161) |
Apr
(117) |
May
(78) |
Jun
(94) |
Jul
(60) |
Aug
(83) |
Sep
(102) |
Oct
(132) |
Nov
(154) |
Dec
(96) |
| 2015 |
Jan
(45) |
Feb
(138) |
Mar
(176) |
Apr
(132) |
May
(119) |
Jun
(124) |
Jul
(77) |
Aug
(31) |
Sep
(34) |
Oct
(22) |
Nov
(23) |
Dec
(9) |
| 2016 |
Jan
(26) |
Feb
(17) |
Mar
(10) |
Apr
(8) |
May
(4) |
Jun
(8) |
Jul
(6) |
Aug
(5) |
Sep
(9) |
Oct
(4) |
Nov
|
Dec
|
| 2017 |
Jan
(5) |
Feb
(7) |
Mar
(1) |
Apr
(5) |
May
|
Jun
(3) |
Jul
(6) |
Aug
(1) |
Sep
|
Oct
(2) |
Nov
(1) |
Dec
|
| 2018 |
Jan
|
Feb
|
Mar
|
Apr
(1) |
May
|
Jun
|
Jul
|
Aug
|
Sep
|
Oct
|
Nov
|
Dec
|
| 2020 |
Jan
|
Feb
|
Mar
|
Apr
|
May
(1) |
Jun
|
Jul
|
Aug
|
Sep
|
Oct
|
Nov
|
Dec
|
| 2025 |
Jan
(1) |
Feb
|
Mar
|
Apr
|
May
|
Jun
|
Jul
|
Aug
|
Sep
|
Oct
|
Nov
|
Dec
|
|
From: Paul B. <ba...@st...> - 2004-07-16 12:31:57
|
Serge Barral wrote: >I'm a new user of matlibplot, and have difficulties in making mathtext to work with the PS backend. Instead of the math symbols, the raw TeX expression is displayed. Mathtext works fine on the GUI backends and on raster images output, though. > >The following quote from matplotlib web page made suggests that mathtext should work for PS output: >"mathtext now embeds the TrueType computer modern fonts into the PS file, so what you see on the screen should be what you get on paper" >Did I misunderstood? > > What version of matplotlib are you using? Versions earlier than 0.60.2 may not work. I just uploaded improved TrueType Font (TTF) support for PS last night, so the version on CVS should fix this. Please give it a try and let me know if you have any problems. >I am on debian unstable and initially tried Vittorio's packages. Thinking that this could be the problem, I resolved to install matplotlib from sources, but the result is the same. >I did check that BUILD_FT2FONT=1 is set. > > -- Paul -- Paul Barrett, PhD Space Telescope Science Institute Phone: 410-338-4475 ESS/Science Software Branch FAX: 410-338-4767 Baltimore, MD 21218 |
|
From: Serge B. <se...@op...> - 2004-07-16 08:37:05
|
I'm a new user of matlibplot, and have difficulties in making mathtext to work with the PS backend. Instead of the math symbols, the raw TeX expression is displayed. Mathtext works fine on the GUI backends and on raster images output, though. The following quote from matplotlib web page made suggests that mathtext should work for PS output: "mathtext now embeds the TrueType computer modern fonts into the PS file, so what you see on the screen should be what you get on paper" Did I misunderstood? I am on debian unstable and initially tried Vittorio's packages. Thinking that this could be the problem, I resolved to install matplotlib from sources, but the result is the same. I did check that BUILD_FT2FONT=1 is set. Thank you in advance for any help, Serge |
|
From: Stephen W. <ste...@cs...> - 2004-07-15 22:40:49
|
As a new user of matplotlib, I'm surprised I haven't seen this mentioned, offhand, in the mailing list archive. I am not seeing the redraw or close widgets on the plot windows I produce. The platform is Fedora Core 1, although I built on RHEL3 because matplotlib-0.60-2 won't build on FC1 (some problem with tk-devel, apparently). -- Stephen Walton <ste...@cs...> Dept. of Physics & Astronomy, Cal State Northridge |
|
From: John H. <jdh...@ac...> - 2004-07-15 18:49:15
|
>>>>> "Kenneth" == Kenneth McDonald <ken...@sb...> writes:

    Kenneth> The easiest way to describe this is to repeat the info
    Kenneth> that's been posted into the "macpython" mailing
    Kenneth> list--sorry if you've already seen it. According to one
    Kenneth> of the people who helped me on the macpython list, the
    Kenneth> problem I'm having is likely caused by matplotlib using a
    Kenneth> custom method of finding Tcl/Tk headers, rather than by a
    Kenneth> Python/OS X interaction problem, which is why I'm
    Kenneth> bringing the topic over to this list.

The file I attached in my last email had an error in it.  It would
probably work for darwin, but fail for linux.  Here is the correct
file

http://matplotlib.sf.net/setupext.py

JDH
|
|
From: John H. <jdh...@ac...> - 2004-07-15 14:15:45
|
>>>>> "MWallis" == MWallis  <mw...@sw...> writes:


    MWallis> This has been my first time using matplotlib and it has
    MWallis> not been entirely successful .  I was asked to develop a
    MWallis> GUI using Python and omniORB to connect as a client to a
    MWallis> server and request a data stream which they wanted me to
    MWallis> display.  There is a considerable amount of data that is
    MWallis> generated and I am not sure that Python was going to be
    MWallis> able to handle it.  I developed the app in Python and was
    MWallis> able to connect to the server using omniORB and register
    MWallis> a callback and receive the data.  This worked fine.  I
    MWallis> then created the GUI using matplotlib and pygtk.  The
    MWallis> display included 2 spectrograms a pan display and 2 bar
    MWallis> charts.  After data of the appropriate type was received
    MWallis> they wanted the displays to be updated dynamically.  I
    MWallis> used threading but it still seemed that after awhile the
    MWallis> GUI would lock up.  Are there any examples available that
    MWallis> embed multiple dynamically updated figures using gtk? I'm
    MWallis> afraid that if I can't get this fixed they will write
    MWallis> python and matplotlib off and refuse to use it again.

Hi Melissa,

I have little experience with threads and try to avoid using them
directly - I'll leave that to the pros.  I suggest another approach -
a useful pygtk trick is to use the idle manager to avoid calls when
gtk is busy.  In the script below, new axes images are created and
drawn only when gtk is idle.  It doesn't do you any good to force feed
gtk data it can't handle, so only make calls through the idle handler.

I simulate a data event generator that calls one of two image axes.
On my system, I get about 10 frames per second with the script below
using gtkagg (gtkagg will probably be a little faster than gtk, which
uses string methods to render image data).

As for your clients giving up on us, remind them that image handling
in matplotlib has gotten an order of magnitude faster in the last 5
months and that further enhancements for dynamic updating are in the
works.  One important one will be the ability to render only selective
parts of the canvas (eg, just redraw the axes image portion rather
than the entire canvas).  My guess is that this change alone would
roughly double the performance of gtkagg for dynamic images.  Other
optimizations specifically for updating image data would provide
further performance enhancements, since this is a simple agg->agg
rendering buffer transfer.

Also, although matplotlib-0.60.2 was just released, a bug that affects
image data with data extent set (eg specgram data) was recently fixed
in CVS.  You may want to work with
http://nitace.bsd.uchicago.edu:8080/files/share/matplotlib-0.60.3a.tar.gz.
It's not a critical update as the bug is only exposed in the following
combination: 1) image data with extent set, 2) image.origin = 'lower'
and 3) you have changed the axes limits from their defaults.  May seem
arcane, but nonetheless, Andrew Straw managed to find it within about
6 minutes of my CVS checkin.

Let me know if this helps,
JDH

#!/usr/bin/env python
"""
An animated image
"""
import sys, time, os, gc
from matplotlib import rcParams

from matplotlib.matlab import *
import gtk

# if hold is on the axes images will accumulate and your performance
# will tank!
rc('axes', hold=False)

class HandleDraws:
    drawing_idle_id = 0
    shape = 100,100  # image size
    cnt = 0
    def __init__(self):
        self.fig = figure(1)
        self.a1 = subplot(211)
        self.a2 = subplot(212)

    def idle_update(self, *args):
        'only call a draw if gtk is idle'
        if self.cnt==0: self.tstart = time.time()
        draw()
        self.drawing_idle_id = 0
        self.cnt += 1
        if self.cnt>=50:
            print 'FPS', self.cnt/(time.time() - self.tstart)
            sys.exit()

        return False

    def update1(self, data):
        if self.drawing_idle_id == 0:
            self.a1.imshow(data, interpolation='nearest')
            self.drawing_idle_id = gtk.idle_add(self.idle_update)
        else: print 'dropping frame for axes 1'

    def update2(self, data):
        if self.drawing_idle_id == 0:
            self.a2.imshow(data, interpolation='nearest')
            self.drawing_idle_id = gtk.idle_add(self.idle_update)
        else: print 'dropping frame for axes 2'

handler = HandleDraws()

def generate_events(*args):
    data = rand(100,100)

    # randomly pick which axes to update
    if rand()>0.5: handler.update1(data)
    else:          handler.update2(data)
    return True

cnt = 0

gtk.timeout_add(10, generate_events)
show()
|
|
From: John H. <jdh...@ac...> - 2004-07-15 12:56:45
|
>>>>> "Jeff" == Jeff Whitaker <js...@fa...> writes:

    Jeff> I'm pretty sure it's not the data.  I only see this when I
    Jeff> use imshow, not pcolor.

OK, I'll get this sorted out.  Thanks for letting me know.

    Jeff> Sure.  I've reworked the example a bit - now I read in a
    Jeff> regular lat/lon grid from a pickle and use numarray's spline
    Jeff> interpolation function to interpolate to the native
    Jeff> projection grid.  Here's the modified example:

It looks very nice.  Perry Greenfield has provided a nice framework
with matplotlib.colors.LinearSegmentedColormap to define new
colormaps.  You can create new colormaps fairly easy by following the
example of jet in matplotlib.cm.  It would be very nice if you could
add some of the common cartographic colormaps.  If you do get the time
to do so when working on your mapping code, here are the steps

  * define your rgb linear segments in matplotlib.cm, following the lead
    of the _jet_data dictionary in that module

  * add an entry to the datad dictionary in that module which maps rc
    string names for your color map to the dictionary you just
    defined.

  * instantiate a single instance of your colormap in cm, following
    the example

    jet =  colors.LinearSegmentedColormap('jet',  _jet_data, LUTSIZE)

  * add a matplotlib.matlab function which has the same name as your
    colormap, following the example of matplotlib.matlab.jet.

Now anyone can use the colormap interactively from the shell, by
setting it as the default image.cmap in rc, etc.

JDH
|
|
From: John H. <jdh...@ac...> - 2004-07-15 12:47:34
|
>>>>> "Charles" == Charles R Twardy <cha...@in...> writes:

    Charles> I can't see the matplotlib package with "apt-get".  I
    Charles> have these lines in my sources.list and I've rerun
    Charles> "apt-get update".

    Charles> # Matplotlib deb http://mentors.debian.net/debian
    Charles> unstable main contrib non-free deb-src
    Charles> http://mentors.debian.net/debian unstable main contrib
    Charles> non-free

    Charles> I can see matplotlib-doc, but not matplotlib. Any ideas?

Hi Charles, I think messages about the debian distribution should be
sent to the devel list; I'm not sure Vittorio reads the users list.
I've CCd him on this email.

Cheers,
JDH
|
|
From: John H. <jdh...@ac...> - 2004-07-15 12:36:52
|
>>>>> "Brett" == Brett Calcott <br...@co...> writes:

    Brett> win32, xp, python 2.3.3 matplotlib: __version__ = '0.60.2'
    Brett> __revision__ = '$Revision: 1.64 $'

    Brett> Any attempt to save ps: savefig('fig.ps')

    Brett> gives this:

    Brett> Fatal Python error: PyEval_RestoreThread: NULL tstate

    Brett> This application has requested the Runtime to terminate it
    Brett> in an unusual way.  Please contact the application's
    Brett> support team for more information.

    Brett> The postscript file *is* actually written.

    Brett> What more info do you need to track this?

Bizarre - on virtually the same platform (windows xp, 0.60.2,
enthought python 2.3.3) I can save PS either directly

  > python simple_plot.py -dPS

or from the GUI by clicking save and using a ps or eps extension with
no troubles, warnings or errors.

As for more information: how are you running matplotlib when you try
to save ps (ie from a GUI window, from an IDE, by setting ps as the
backend in rc, interactively from the python shell)?  Do you still get
the same error when calling a script from the command shell with -dPS
as above?  Which matplotlib windows installer are you using:

  matplotlib-0.60.2-numarray0.9-win32-py2.3.exe
  matplotlib-0.60.2-numarray1.0-win32-py2.3.exe
  matplotlib-0.60.2.win32-py2.3.exe?

What is your numerix setting in
c:\python23\share\matplotlib\.matplotlibrc, or wherever you keep your
rc file?  Do you get this problem when you try to save png with the
agg backend?

After gathering the info above, I suggest removing
c:\python23\lib\site-packages\matplotlib and
c:\python23\share\matplotlib and doing a clean install.

From your message (PyEval_RestoreThread: NULL), I'm guessing you are
running from an IDE (idle?)  with the tkagg backend and are getting a
mainloop conflict.  Have you read
http://matplotlib.sourceforge.net/faq.html#FREEZE?

Good luck!  JDH
|
|
From: Charles R. T. <cha...@in...> - 2004-07-15 04:12:15
|
I can't see the matplotlib package with "apt-get". I have these lines in my sources.list and I've rerun "apt-get update". # Matplotlib deb http://mentors.debian.net/debian unstable main contrib non-free deb-src http://mentors.debian.net/debian unstable main contrib non-free I can see matplotlib-doc, but not matplotlib. Any ideas? -Charles -- Charles R. Twardy www.csse.monash.edu.au/~ctwardy Monash University sarbayes.org Computer Sci. & Software Eng. +61(3) 9905 5823 (w) 5146 (fax) Allow the president to invade a neighboring nation, whenever he shall deem it necessary to repel an invasion, ... and you allow him to make war at pleasure. --Abraham Lincoln |
|
From: Philip A. <pa...@eo...> - 2004-07-15 03:36:10
|
Jeff Whitaker writes: > When I get some time I'd like to wrap some of this in some > easy-to-use functions, maybe with an interface similar to the > matlab mapping toolbox. That would be very nice -- I think the matlab mapping/colorscaling examples at http://www.mathworks.com/company/newsletters/digest/nov02/earth_pt4.html http://www.mathworks.com/matlabcentral/fileexchange/loadFile.do?objectType=file&objectId=2611 represent the vast majority of things that people would want to do with map/image overlays. Regards, Phil |
|
From: Jeff W. <js...@fa...> - 2004-07-15 02:50:47
|
On Wed, 14 Jul 2004, John Hunter wrote: >>>>>> "Jeff" == Jeff Whitaker <js...@fa...> writes: > > I noticed that the lat/lon lines don't precisely agree with the > colormap, eg around the Aleutian Islands the light blue is not > perfectly registered with the black lines. Should I be concerned that > this reflects a problem in matplotlib, or is this kind of error > standard in the data you've provided? I think this is related to the > pixel border that appears around some images, and is magnified when > interpolation is used because the top and right borders are not > defined when interpolating. I'll continue to look into this. I'm pretty sure it's not the data. I only see this when I use imshow, not pcolor. > > Would it be OK if I used this example on the web page? I like it! > Sure. I've reworked the example a bit - now I read in a regular lat/lon grid from a pickle and use numarray's spline interpolation function to interpolate to the native projection grid. Here's the modified example: from matplotlib.matlab import * from matplotlib.collections import LineCollection from proj import Proj import numarray, cPickle from numarray import nd_image # example to demonstrate plotting data on a map projection. # requires numarray, proj module (which in turn requires # proj command from http://proj.maptools.org) # set up map projection parameters (lambert conformal conic, # standard parallels at 50 deg N, center longitued 107 deg W. params = {} params['proj'] = 'lcc' params['R'] = 63712000 params['lat_1'] = 50 params['lat_2'] = 50 params['lon_0'] = -107 proj = Proj(params) llcornerx, llcornery = proj(-145.5,1.) xmax=11297266.68; ymax=8959901.16 params['x_0'] = -llcornerx # add cartesian offset so lower left corner = (0,0) params['y_0'] = -llcornery # create a Proj instance for desired map. proj = Proj(params) # define grid (nx x ny regularly spaced native projection grid) nx = 349; ny = 277 dx = xmax/(nx-1); dy = ymax/(ny-1) xgrid = dx*numarray.indices((ny,nx))[1,:,:] ygrid = dy*numarray.indices((ny,nx))[0,:,:] # compute lons, lats of regular projection grid. lonout, latout = proj(xgrid, ygrid, inverse=True) # make sure lons are between 0 and 360 lonout = numarray.where(lonout < 0, lonout+360, lonout) latout = latout+90 # read in topo data from pickle (on a regular lat/lon grid) topodict = cPickle.load(open('etopo20.pickle','rb')) lons = topodict['lons'] lats = topodict['lats'] topoin = topodict['topo'] # find coordinates of native projection grid. xcoords = (len(lons)-1)*(lonout-lons[0])/(lons[-1]-lons[0]) ycoords = (len(lats)-1)*(latout-lats[0])/(lats[-1]-lats[0]) coords = [ycoords,xcoords] # interpolate to projection grid using numarray.nd_image spline filter. topodat = numarray.nd_image.map_coordinates(topoin,coords,mode='nearest') ax = subplot(111) # use imshow rather than pcolor for speed # set the default params for imshow rc('image', origin='lower', cmap='jet') im = ax.imshow(topodat, interpolation='nearest',extent=(0, xmax, 0, ymax)) #pcolor(xgrid, ygrid, topodat, shading='flat') # read in coastline data from pickle. wcl = cPickle.load(open('wcl.pickle','rb')) ind = wcl['segment_index']; lons = wcl['lons']; lats = wcl['lats'] # transform coastline segements to map projection coordinates. xs, ys = proj(lons,lats) # a sequence of xy tuples segments = [zip(xs[i0:i1], ys[i0:i1]) for i0, i1 in zip(ind[:-1], ind[1:])] # line collection collection = LineCollection( segments, colors = ( (0,0,0,1), ), # black linewidths = (1.5,), antialiaseds = (1,),) # turn off aa for speed ax.add_collection(collection) corners = (min(xs), min(ys)), (max(xs), max(ys)) ax.update_datalim( corners ) axis([0, xmax, 0, ymax]) ax.set_xticks([]) # no ticks ax.set_yticks([]) title('20-minute Topography: Lambert Conformal Conic Projection') show() I've tarred up all the pickles and scripts to run this at http://whitaker.homeunix.org/~jeff/plotmap.tar.gz. The resulting image is at http://whitaker.homeunix.org/~jeff/plotmap.png. When I get some time I'd like to wrap some of this in some easy-to-use functions, maybe with an interface similar to the matlab mapping toolbox. Thanks for all your help! -Jeff -- Jeffrey S. Whitaker Phone : (303)497-6313 NOAA/OAR/CDC R/CDC1 FAX : (303)497-6449 325 Broadway Web : http://www.cdc.noaa.gov/~jsw Boulder, CO, USA 80305-3328 Office: Skaggs Research Cntr 1D-124 |
|
From: Brett C. <br...@co...> - 2004-07-15 02:34:54
|
win32, xp, python 2.3.3
matplotlib:
__version__  = '0.60.2'
__revision__ = '$Revision: 1.64 $'

Any attempt to save ps:
savefig('fig.ps')

gives this:

Fatal Python error: PyEval_RestoreThread: NULL tstate

This application has requested the Runtime to terminate it in an unusual
way.
Please contact the application's support team for more information.

The postscript file *is* actually written.

What more info do you need to track this?


--
Brett Calcott
Philosophy Program, RSSS, ANU
Canberra, ACT 0200, AUSTRALIA
|
|
From: Kenneth M. <ken...@sb...> - 2004-07-15 00:35:12
|
The easiest way to describe this is to repeat the info that's been posted into the "macpython" mailing list--sorry if you've already seen it. According to one of the people who helped me on the macpython list, the problem I'm having is likely caused by matplotlib using a custom method of finding Tcl/Tk headers, rather than by a Python/OS X interaction problem, which is why I'm bringing the topic over to this list. Many thanks for any help you can offer! Here's what has gone before, consisting of questions from me and answers from other people. I've done some editing to shorten things up. >>>> I'm attempting to compile matplotlib, and get messages saying that >>>> it can't find the headers for Tcl/Tk. They exist, they just happen >>>> to >>>> be in the Frameworks directories for Tcl and for Tk. I know I can >>>> get this to work by hacking (setting up path variables, putting >>>> symbolic >>>> links in directories, or some such), but aside from the fact that >>>> that's >>>> a pain and ugly, it doesn't solve the more general problem; if >>>> header >>>> files are supposed to be in Frameworks directories (for example, I >>>> found my Tk header files in >>>> /Library/Frameworks/Tk.framework/Headers), >>>> what is the best way to set up OS X so that they will be available >>>> to link >>>> against? >>> Short answer: Whatever you're trying to build is (incorrectly) not >>> using tclConfig.sh (they should allow the user to choose which one, >>> but should default to /usr/lib/tclConfig.sh I guess). This is >>> equivalent to not using distutils. It probably won't be a problem >>> in the Mac OS X future however, because... >>> >>> Apple's latest strategy for unixy stuff (at least for Python) seems >>> to be a hybrid approach that should please almost anyone: >>> (1) the actual dylib lives in /usr/lib and has a mach-o id pointing >>> to /usr/lib >>> (2) the framework has symlinks to /usr/lib for its dylib >>> (3) the headers live in the framework >>> (4) /usr/include has appropriate symlinks into the framework >>> >>> [I can say this without breaking NDA because Apple has publicly >>> released their sources for Python in Darwin 8.0.0b1] >> >> After reading Bob's message, I looked into /usr/lib and found that >> while >> it contained a tclConfig.sh, there was no tkConfig.sh. A search of the >> file system revealed a tkConfig.sh in >> /Library/Framewords/Tk.framework, so >> I copied it there. >> >> While I suspect this was a Good Thing To Do, it still hasn't solved >> the problem of matplotlib's setup.py not being able to find the tcl/tk >> headers. Here's my attempt at building and the resultant message: >> >> ken% python setup.py build >> GTKAgg requires pygtk >> cannot find tcl/tk headers. giving up. >> >> The message about "GTKAgg" is expected and should be ignored. >> Attempting >> a "python setup.py -v build" gave exactly the same error messages. >> Unfortunately >> the error message about the header, while to the point, isn't >> terribly helpful :-) >> >> matplotlib is packaged using distutil, and presumably distutil isn't >> getting >> the info it needs to figure out where the headers are. I've started >> reading >> about distutil, but am a novice at it (and it's a fairly involved >> package, as >> well), so if others could offer suggestions as to how to track >> down/fix this >> problem, it would be a real help. >> > distutils is only good at finding Python's compiler/linker settings > and Python's headers. > matplotlib has custom code to find Tcl/Tk in its setup.py, and that > custom code is not doing the right thing. |
|
From: John H. <jdh...@ac...> - 2004-07-14 14:37:39
|
>>>>> "Matthew" == Matthew O'Connnor <mat...@ca...> writes:

    Matthew> Hi, I was wondering if anybody else was seeing memory
    Matthew> leaks in the latest version (0.60.2).

    Matthew> I'm using the Agg backend to produce images for web
    Matthew> pages.

    Matthew> The release notes for 0.60.2 indicate that memory leaks
    Matthew> have been fixed.  Are there any known leaks left?

Yes, when I say memory leaks were fixed, I mean I identified and fixed
some, but am not claiming that all are fixed.  There are known memory
leaks.  For example, there is a small leak in freetype2 that was fixed
in freetype CVS but may not be released yet.  There appears to be a
leak in _backend_agg's write_png method, but I haven't traced this
sufficiently to find if it is in my code or in libpng or in zlib.

The whole memory leak situation has continued to improve as I've
migrated almost all of the extension code to pycxx, and I have a
number of unit tests to test leaks in various components.  For
example, there are no detectable leaks in the transforms module.

Below is a prototypical script that I use to diagnose and report
memory leaks.  Please use something like it when reporting leaks so I
get an idea of the magnitude of the problem (ie bytes per figure).
Also please provide your platform, matplotlib version, backend and as
much information about the versions of the libraries you are using:
freetype, png and zlib.  It would also help if you posted code so I
could look for any obvious coding errors vis-a-vis matplotlib.

Running the code below, I'm getting about 400 bytes / per / figure
(matplotlib-0.60.2 / agg on linux with freetype 2.17, libpng1.2 and
libz 1.1.4).  I know leaks of this size can cause troubles on an
application server, and in animated figures, and will continue to try
and track them down.  As I noted above, some of this results from the
libraries on which matplotlib depends, and so may be system and
version dependent.  If your numbers are much worse, it may be that you
are doing something wrong, ie, not properly closing, reusing figure,
etc.

Let me know what you find,
JDH

import os, sys, time
import matplotlib
matplotlib.use('Agg')
from matplotlib.matlab import *


def report_memory(i):
    pid = os.getpid()
    a2 = os.popen('ps -p %d -o rss,sz' % pid).readlines()
    print i, '  ', a2[1],
    return int(a2[1].split()[1])

N = 100
for i in range(N):
    ind = arange(100)
    xx = rand(len(ind), 1)
    figure(1)
    plot(ind, xx[:,0])
    savefig('tmp%d.png' % i, dpi = 75)
    close(1)

    val = report_memory(i)
    if i==1: start = val

end = val
print 'Average memory consumed per loop: %1.4fk bytes\n' % ((end-start)/float(N))
|
|
From: John H. <jdh...@ac...> - 2004-07-14 14:23:18
|
>>>>> "Jeff" == Jeff Whitaker <js...@fa...> writes:

    Jeff> John: I found that if I just call proj with all the lats and
    Jeff> lons at once (instead of once for each segment) I can speed
    Jeff> it up tremendously. Here's what I tried, using the new
    Jeff> LineCollection snippets you sent me, and the updated
    Jeff> matplotlib snapshot:

Yep - very good idea.  Your mistake with the line collection is how
you define the segments.  From matplotlib.collections.LineCollection
documentation

    segments is a sequence of ( line0, line1, line2), where linen =
    (x0, y0), (x1, y1), ... (xm, ym).  Each line can be a different
    length

That is, it is a sequence of sequences of xy tuples.  When you write
zip(xs.tolist(),ys.tolist()), you have a sequence of xy tuples.  If
you plotted this, you would have one giant, connected line, which is
not what you want.  You want a series of disconnected lines.  Thus you
need to keep track of the indices where each separate segment starts,
and split out the segments, as in the code below.

For future reference, you may also want to use PolyCollections if you
want to generate a map and you have a bunch of segments defined by
sequences of xy tuples with associated face colors.

There was no significant difference between using bilinear
interpolation with antialiased drawing vs nearest neighbor
interpolation w/o aa, so I turned both back on.

And don't forget to try the new toolbar....

I noticed that the lat/lon lines don't precisely agree with the
colormap, eg around the Aleutian Islands the light blue is not
perfectly registered with the black lines.  Should I be concerned that
this reflects a problem in matplotlib, or is this kind of error
standard in the data you've provided?  I think this is related to the
pixel border that appears around some images, and is magnified when
interpolation is used because the top and right borders are not
defined when interpolating.  I'll continue to look into this.

Would it be OK if I used this example on the web page?  I like it!

Enjoy,
JDH

import cPickle
from matplotlib.matlab import *
from matplotlib.collections import LineCollection
from proj import Proj
import Numeric

# standard parallels at 50 deg N, center longitued 107 deg W.
params = {}
params['proj'] = 'lcc'
params['R'] = 63712000
params['lat_1'] = 50
params['lat_2'] = 50
params['lon_0'] = -107
proj = Proj(params)
llcornerx, llcornery = proj(-145.5,1.)
params['x_0'] = -llcornerx # add cartesian offset so lower left corner = (0,0)
params['y_0'] = -llcornery
# create a Proj instance for desired map.
proj = Proj(params)

# set the default params for imshow
rc('image', origin='lower', cmap='jet')
ax = subplot(111)
nx = 349; ny = 277
dx = 32463.41; dy = 32463.41
xmax = (nx-1)*dx; ymax = (ny-1)*dy # size of domain to plot

C = cPickle.load( file('topodata.pickle','rb') )
im = ax.imshow(C, interpolation='bilinear',
               extent=(0, xmax, 0, ymax))

# ind is the index for the start of a new group
lons = []; lats = []; ind = []
i = 0  # the current ind
for line in file('wcl.txt'):
    if line.startswith('# -b'):
        ind.append(i)
        continue

    # lon/lat
    lon, lat = [float(val) for val in line.split('\t')]
    lons.append(lon)
    lats.append(lat)
    i += 1

xs, ys = proj(Numeric.array(lons),Numeric.array(lats))
#a sequence of xy tuples
segments = [zip(xs[i0:i1], ys[i0:i1]) for i0, i1 in zip(ind[:-1], ind[1:])]


collection = LineCollection(
    segments,
    colors       = ( (0,0,0,1), ), # black
    linewidths   = (1.5,),
    antialiaseds = (1,),)  # turn off aa for speed
ax.add_collection(collection)
corners = (min(xs), min(ys)), (max(xs), max(ys))
ax.update_datalim( corners )
axis([0, xmax, 0, ymax])
ax.set_xticks([]) # no ticks
ax.set_yticks([])
title('Lambert Conformal Conic Projection')
#savefig('test')
show()
|
|
From: Jeff W. <js...@fa...> - 2004-07-14 12:26:31
|
On Tue, 13 Jul 2004, John Hunter wrote:

>
> OK, made some headway here.
>
....
>
> For the line part of the map, I extended the
> matplotlib.collections.LineCollection class to handle a sequence of
> lines, where each line is defined by a list of tuples (x0,y0), (x1,
> y1), ...  Thus all of your lines are handled by a single object,
> rather than having 1800+ separate line objects created in plot.
> Again, no python loops required.
>
> In the current form, the code takes about 1.15s to run on my machine
> and is about 30x faster than the original code you posted which
> includes the data loading part.  Nonetheless, the matplotlib part is
> much faster too, as you'll see when you interact with the data.
>

John:  I found that if I just call proj with all the lats and lons at
once (instead of once for each segment) I can speed it up tremendously.
Here's what I tried, using the new LineCollection snippets you sent me,
and the updated matplotlib snapshot:


from matplotlib.matlab import *
from matplotlib.collections import LineCollection
from proj import Proj
import Numeric, time

# open file with coastline data (from world coastline database).
wcl = open('wcl.txt')

# set up map projection parameters (lambert conformal conic,
# standard parallels at 50 deg N, center longitued 107 deg W.
params = {}
params['proj'] = 'lcc'
params['R'] = 63712000
params['lat_1'] = 50
params['lat_2'] = 50
params['lon_0'] = -107
proj = Proj(params)
llcornerx, llcornery = proj(-145.5,1.)
params['x_0'] = -llcornerx # add cartesian offset so lower left corner = (0,0)
params['y_0'] = -llcornery
# create a Proj instance for desired map.
proj = Proj(params)

# set the default params for imshow
rc('image', origin='lower', cmap='jet')

ax = subplot(111)
nx = 349; ny = 277
dx = 32463.41; dy = 32463.41
xmax = (nx-1)*dx; ymax = (ny-1)*dy # size of domain to plot

t1 = time.clock()
segnum = 0
lons = []
lats = []
for line in wcl:
     splitline = line.split()
     if splitline[0] != '#':
         lon = float(splitline[0])
 	lat = float(splitline[1])
 	lons.append(lon)
 	lats.append(lat)
xs, ys = proj(Numeric.array(lons),Numeric.array(lats))
minx, maxx = min(xs), max(xs)
miny, maxy = min(ys), max(ys)
xypts = zip(xs.tolist(),ys.tolist())

wcl.close() # close coastline file
# all args are sequences, length 1 in case of linewidths and
# antialiased
collection = LineCollection(segments     = xypts,
                             colors       = ( (0,0,0,1), ), # black
                             linewidths   = (1.5,),
                             antialiaseds = (0,),)  # turn off aa for speed
ax.add_collection(collection)
ax.update_datalim( ((minx, miny), (maxx, maxy)))

axis([0, xmax, 0, ymax])
ax.set_xticks([]) # no ticks
ax.set_yticks([])
title('Lambert Conformal Conic Projection')
t2 = time.clock()
print t2-t1
show()

But when I run it, I get the following error:

Traceback (most recent call last):
   File
"/sw/lib/python2.3/site-packages/matplotlib/backends/backend_gtkagg.py",
line 75, in callback
     self.draw()
   File
"/sw/lib/python2.3/site-packages/matplotlib/backends/backend_gtkagg.py",
line 42, in draw
     agg.draw()
   File
"/sw/lib/python2.3/site-packages/matplotlib/backends/backend_agg.py", line
291, in draw
     self.figure.draw(self.renderer)
   File "/sw/lib/python2.3/site-packages/matplotlib/figure.py", line 236,
in draw
     for a in self.axes: a.draw(renderer)
   File "/sw/lib/python2.3/site-packages/matplotlib/axes.py", line 668, in
draw
     c.draw(renderer)
   File "/sw/lib/python2.3/site-packages/matplotlib/collections.py", line
286, in draw
     self._transOffset)
TypeError: CXX: type error.


-Jeff

  --
Jeffrey S. Whitaker         Phone : (303)497-6313
NOAA/OAR/CDC  R/CDC1        FAX   : (303)497-6449
325 Broadway                Web   : http://www.cdc.noaa.gov/~jsw
Boulder, CO, USA 80305-3328 Office: Skaggs Research Cntr 1D-124
|
|
From: Matthew O'C. <mat...@ca...> - 2004-07-14 01:37:29
|
Hi, I was wondering if anybody else was seeing memory leaks in the latest version (0.60.2). I'm using the Agg backend to produce images for web pages. The release notes for 0.60.2 indicate that memory leaks have been fixed. Are there any known leaks left? Cheers, Matthew O'Connor |
|
From: Jeff W. <js...@fa...> - 2004-07-13 22:51:49
|
On Tue, 13 Jul 2004, John Hunter wrote: John: > > OK, made some headway here. > > When profiling for performace, I often turn off the GUI so my numbers > aren't influenced by the user interface > > > /usr/local/lib/python/profile.py plotmap.py -dAgg > prof.out > > Here are the profile results sorted by cumulative time for your script > - only the most expensive functions are shown > > 7.590 proj.py:43(__call__) > 7.080 os.py:611(popen2) > 7.050 popen2.py:31(__init__) > 7.050 popen2.py:143(popen2) > 2.610 matlab.py:1305(savefig) > > On my system, over half the time is spent running your popen process. > Can't help you with this one :-). To get better numbers and focus on > matplotlib, I cached the xy points that the popen process is > generating to a pickled list. OK - looks like I have to work on the proj module. I probably should make it a C extension that calls the proj library directly instead of communicating with the proj application via pipes. > > You're using pcolor to generate the colormap. pcolor uses > collections, which is already pretty fast (agg implements collection > drawing in extension code, no python loops needed to make a pcolor). > However, you can get better performace still from imshow with the data > limits set. This will approximately double the performance of the > image part of the map. I had to make some changes to matplotlib (see > below) because image origin wasn't playing nicely with image extent - > this also fixes Andrew's bug. > > For the line part of the map, I extended the > matplotlib.collections.LineCollection class to handle a sequence of > lines, where each line is defined by a list of tuples (x0,y0), (x1, > y1), ... Thus all of your lines are handled by a single object, > rather than having 1800+ separate line objects created in plot. > Again, no python loops required. > > In the current form, the code takes about 1.15s to run on my machine > and is about 30x faster than the original code you posted which > includes the data loading part. Nonetheless, the matplotlib part is > much faster too, as you'll see when you interact with the data. > > I'm including a link to a matplotlib snapshot below which includes the > required changes. As a bonus, you can try out the new navigation > toolbar (in progress, only works w/ gtk and gtkagg). It includes a > view limits stack, hand pan, and zoom to rectangle. Much nicer for > map navigation. And with the changes, you can actually interact with > your data with reasonable performance. I need to add some more > features to the toolbar, but give it a test drive and let me know if > you have suggestions. Set 'toolbar: toolbar2' in matplotlibrc Excellent! I'll do some more work on it and repost a (hopefully) faster version. Thanks for the quick response. -Jeff -- Jeffrey S. Whitaker Phone : (303)497-6313 Meteorologist FAX : (303)497-6449 NOAA/OAR/CDC R/CDC1 Email : Jef...@no... 325 Broadway Web : www.cdc.noaa.gov/~jsw Boulder, CO, USA 80303-3328 Office : Skaggs Research Cntr 1D-124 |
|
From: John H. <jdh...@ac...> - 2004-07-13 21:53:07
|
OK, made some headway here.
When profiling for performace, I often turn off the GUI so my numbers
aren't influenced by the user interface
> /usr/local/lib/python/profile.py plotmap.py -dAgg > prof.out
Here are the profile results sorted by cumulative time for your script
- only the most expensive functions are shown
7.590 proj.py:43(__call__)
7.080 os.py:611(popen2)
7.050 popen2.py:31(__init__)
7.050 popen2.py:143(popen2)
2.610 matlab.py:1305(savefig)
On my system, over half the time is spent running your popen process.
Can't help you with this one :-). To get better numbers and focus on
matplotlib, I cached the xy points that the popen process is
generating to a pickled list.
You're using pcolor to generate the colormap. pcolor uses
collections, which is already pretty fast (agg implements collection
drawing in extension code, no python loops needed to make a pcolor).
However, you can get better performace still from imshow with the data
limits set. This will approximately double the performance of the
image part of the map. I had to make some changes to matplotlib (see
below) because image origin wasn't playing nicely with image extent -
this also fixes Andrew's bug.
For the line part of the map, I extended the
matplotlib.collections.LineCollection class to handle a sequence of
lines, where each line is defined by a list of tuples (x0,y0), (x1,
y1), ... Thus all of your lines are handled by a single object,
rather than having 1800+ separate line objects created in plot.
Again, no python loops required.
In the current form, the code takes about 1.15s to run on my machine
and is about 30x faster than the original code you posted which
includes the data loading part. Nonetheless, the matplotlib part is
much faster too, as you'll see when you interact with the data.
I'm including a link to a matplotlib snapshot below which includes the
required changes. As a bonus, you can try out the new navigation
toolbar (in progress, only works w/ gtk and gtkagg). It includes a
view limits stack, hand pan, and zoom to rectangle. Much nicer for
map navigation. And with the changes, you can actually interact with
your data with reasonable performance. I need to add some more
features to the toolbar, but give it a test drive and let me know if
you have suggestions. Set 'toolbar: toolbar2' in matplotlibrc
Thanks much for the fink package - I'll continue to point OS X users
to your site!
JDH
### matplotlib shapshot:
http://nitace.bsd.uchicago.edu:8080/files/share/matplotlib-0.60.3a.tar.gz
### Here is a link to the xy point data:
http://nitace.bsd.uchicago.edu:8080/files/share/xypts.pickled
### Here is the code snippet I used to generate it
xypts = []
for line in wcl:
splitline = line.split()
if splitline[0] == '#':
segnum = segnum + 1
if segnum > 1:
# convert lon,lat to map coordinates x,y
xys = zip(*proj(Numeric.array(lons),Numeric.array(lats)))
xypts.append( xys)
pickle.dump(xypts, file('xypts.pickled', 'w') )
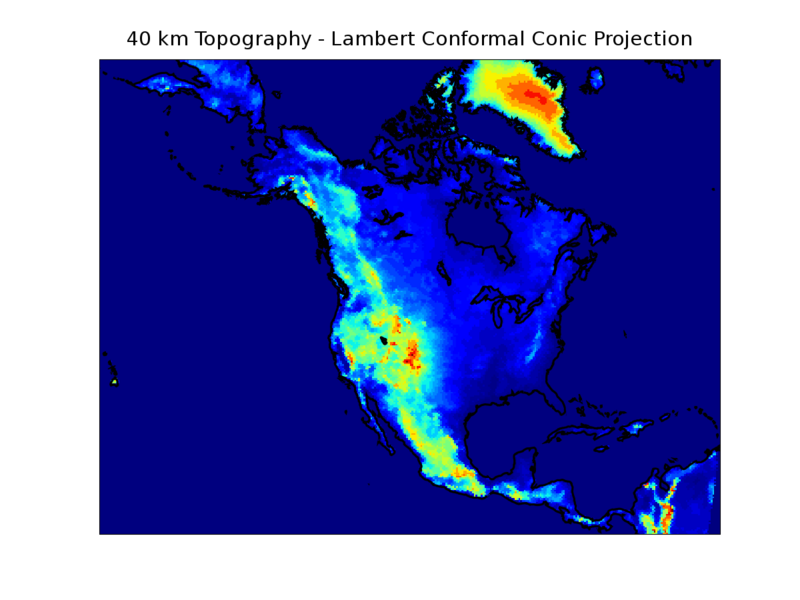
### Here is the modified plotmap script which uses imshow and line
### collections
import time
from matplotlib.matlab import *
from matplotlib.collections import LineCollection
from proj import Proj
import Numeric, cPickle
# set the default params for imshow
rc('image', origin='lower', cmap='jet')
ax = subplot(111)
nx = 349; ny = 277
dx = 32463.41; dy = 32463.41
xmax = (nx-1)*dx; ymax = (ny-1)*dy # size of domain to plot
datin = open('topodata.pickle','rb')
C = cPickle.load(datin)
# use imshow rather than pcolor for speed
im = ax.imshow(C, interpolation='nearest',
extent=(0, xmax, 0, ymax))
xypts = cPickle.load(file('xypts.pickled', 'r') )
# all args are sequences, length 1 in case of linewidths and
# antialiased
collection = LineCollection(segments = xypts,
colors = ( (0,0,0,1), ), # black
linewidths = (1.5,),
antialiaseds = (0,), # turn off aa for speed
)
ax.add_collection(collection)
# you have to manually update the datalim; this is a bit ugly so I'll
# work on the interface
xs = [ x for thisline in xypts for x,y in thisline ]
ys = [ y for thisline in xypts for x,y in thisline ]
minx, maxx = min(xs), max(xs)
miny, maxy = min(ys), max(ys)
ax.update_datalim( ((minx, miny), (maxx, maxy)))
axis([0, xmax, 0, ymax])
ax.set_xticks([]) # no ticks
ax.set_yticks([])
title('40 km Topography - Lambert Conformal Conic Projection')
#savefig('test4')
show()
|
|
From: John H. <jdh...@ac...> - 2004-07-13 14:44:59
|
>>>>> "Andrew" == Andrew Straw <str...@as...> writes:

  Andrew> OK, I discovered a rather easy demonstration of what looks
  Andrew> to be a OK, (possibly the same) bug (adding 'ylim' to the
  Andrew> image_origin demo):

    from matplotlib.matlab import *
    x = arange(100.0); x.shape = 10,10

    subplot(211)
    title('blue should be up')
    imshow(x, origin='upper', interpolation='nearest')
    set(gca(),'ylim',(0,23))

    subplot(212)
    title('blue should be down')
    imshow(x, origin='lower', interpolation='nearest')
    set(gca(),'ylim',(0,23))

    #savefig('image_origin2')
    show()

I agree it looks like a bug.  Just to make sure we are on the same
page: what do you thing the correct behavior should be here?  Do you
think subplot (211) is correct?

The question is: how should image origin interact with the axes
ylimits?  In this example, should both images fill the space from 0-10
on the y axes, regardless of the ylimit setting?  In the origin upper
case, should the blue strip be at 10 and the red strip at zero?  In
the origin lower case, should the blue be at zero and the red at 10?

Inquiring minds want to know.

Thanks,
JDH
|
|
From: Jeff W. <js...@fa...> - 2004-07-13 13:50:57
|
On Tue, 13 Jul 2004, John Hunter wrote: > > I am having trouble running this - proj.py is making the system call > 'stdin,stdout=os.popen2(cmd,mode='b')' where cmd is > > proj +R=63712000 +lon_0=-107 +proj=lcc +lat_1=50 +lat_2=50 -b > > but I don't have proj on my system. Am I missing something? Is this > a tool I can easily install? John: Yes, it's easy to install. You can grab it from http://proj.maptools.org. A simple ./configure; make; make install worked for me. > > Also, while I have your ear, what version of matplotlib are you > working with and what backend do you typically use? I have 0.60.2 and usually use the default gtkagg backend. I work mostly on OS X (I'm actually the fink package maintainer). > > Nice map, by the way! > Thanks - very nice software! -Jeff -- Jeffrey S. Whitaker Phone : (303)497-6313 NOAA/OAR/CDC R/CDC1 FAX : (303)497-6449 325 Broadway Web : http://www.cdc.noaa.gov/~jsw Boulder, CO, USA 80305-3328 Office: Skaggs Research Cntr 1D-124 |
|
From: John H. <jdh...@ac...> - 2004-07-13 13:29:44
|
>>>>> "Jeff" == Jeff Whitaker <js...@fa...> writes:

    Jeff> Hi:

    Jeff> I've hacked together some scripts that let me plot data on
    Jeff> top of world maps with different map projections in
    Jeff> matplotlib.  It's quite slow, but it works!  There's an
    Jeff> example at
    Jeff> http://www.cdc.noaa.gov/people/jeffrey.s.whitaker/plotmap.py
    Jeff> (the plot should look like
    Jeff> http://www.cdc.noaa.gov/people/jeffrey.s.whitaker/plotmap.png).
    Jeff> To run the example you'll need the data files
    Jeff> http://www.cdc.noaa.gov/people/jeffrey.s.whitaker/wcl.txt
    Jeff> (world coastlines) and
    Jeff> http://www.cdc.noaa.gov/people/jeffrey.s.whitaker/topodata.pickle
    Jeff> (data to plot), as well as a module I wrote to compute
    Jeff> cartographic transformations using proj4
    Jeff> http://www.cdc.noaa.gov/people/jeffrey.s.whitaker/python/proj.py.


    Jeff> If anyone knows of a faster way to do this, I'd love to hear
    Jeff> about it.

I am having trouble running this - proj.py is making the system call
'stdin,stdout=os.popen2(cmd,mode='b')' where cmd is

 proj +R=63712000 +lon_0=-107 +proj=lcc +lat_1=50 +lat_2=50 -b

but I don't have proj on my system.  Am I missing something?  Is this
a tool I can easily install?

Also, while I have your ear, what version of matplotlib are you
working with and what backend do you typically use?

Nice map, by the way!

JDH
|
.)
|
From: Jeff W. <js...@fa...> - 2004-07-13 12:00:28
|
Hi: I've hacked together some scripts that let me plot data on top of world maps with different map projections in matplotlib. It's quite slow, but it works! There's an example at http://www.cdc.noaa.gov/people/jeffrey.s.whitaker/plotmap.py (the plot should look like http://www.cdc.noaa.gov/people/jeffrey.s.whitaker/plotmap.png). To run the example you'll need the data files http://www.cdc.noaa.gov/people/jeffrey.s.whitaker/wcl.txt (world coastlines) and http://www.cdc.noaa.gov/people/jeffrey.s.whitaker/topodata.pickle (data to plot), as well as a module I wrote to compute cartographic transformations using proj4 http://www.cdc.noaa.gov/people/jeffrey.s.whitaker/python/proj.py. If anyone knows of a faster way to do this, I'd love to hear about it. -Jeff -- Jeffrey S. Whitaker Phone : (303)497-6313 NOAA/OAR/CDC R/CDC1 FAX : (303)497-6449 325 Broadway Web : http://www.cdc.noaa.gov/~jsw Boulder, CO, USA 80305-3328 Office: Skaggs Research Cntr 1D-124 |
|
From: Andrew S. <str...@as...> - 2004-07-13 01:07:16
|
John Hunter wrote:

>
>    Andrew> John+Perry+whoever: the only matplotlib bug I found this
>    Andrew> time is worked around by the line
>
>    >> rcParams['image.origin'] = 'upper' # 'lower': nav toolbar
>    >> problem -ADS
>
>    Andrew> We should fix that at some point.
>
>What was the bug?  I didn't notice any problems with lower.
>
>
OK, I discovered a rather easy demonstration of what looks to be a
(possibly the same) bug (adding 'ylim' to the image_origin demo):

from matplotlib.matlab import *

x = arange(100.0); x.shape = 10,10


subplot(211)
title('blue should be up')
imshow(x, origin='upper', interpolation='nearest')
set(gca(),'ylim',(0,23))

subplot(212)
title('blue should be down')
imshow(x, origin='lower', interpolation='nearest')
set(gca(),'ylim',(0,23))

#savefig('image_origin2')
show()
|
|
From: Andrew S. <as...@ca...> - 2004-07-11 01:12:03
|
John Hunter wrote: > Andrew> John+Perry+whoever: the only matplotlib bug I found this > Andrew> time is worked around by the line > > >> rcParams['image.origin'] = 'upper' # 'lower': nav toolbar > >> problem -ADS > > Andrew> We should fix that at some point. > >What was the bug? I didn't notice any problems with lower. > > Try vertically zooming and panning with the matplotlib toolbar -- you'll see that the overlay points move opposite from the data. Maybe it's my head that's on wrong, though. :) >Updates are in CVS - thanks for the submission. > > Thanks for the suggestions. You'll make a respectable (matplotlib) programmer out of me yet! Cheers! Andrew |
657 messages has been excluded from this view by a project administrator.