Menu
▾
▴
matplotlib-devel — matplotlib developers
You can subscribe to this list here.
| 2003 |
Jan
|
Feb
|
Mar
|
Apr
|
May
|
Jun
|
Jul
|
Aug
|
Sep
|
Oct
(1) |
Nov
(33) |
Dec
(20) |
|---|---|---|---|---|---|---|---|---|---|---|---|---|
| 2004 |
Jan
(7) |
Feb
(44) |
Mar
(51) |
Apr
(43) |
May
(43) |
Jun
(36) |
Jul
(61) |
Aug
(44) |
Sep
(25) |
Oct
(82) |
Nov
(97) |
Dec
(47) |
| 2005 |
Jan
(77) |
Feb
(143) |
Mar
(42) |
Apr
(31) |
May
(93) |
Jun
(93) |
Jul
(35) |
Aug
(78) |
Sep
(56) |
Oct
(44) |
Nov
(72) |
Dec
(75) |
| 2006 |
Jan
(116) |
Feb
(99) |
Mar
(181) |
Apr
(171) |
May
(112) |
Jun
(86) |
Jul
(91) |
Aug
(111) |
Sep
(77) |
Oct
(72) |
Nov
(57) |
Dec
(51) |
| 2007 |
Jan
(64) |
Feb
(116) |
Mar
(70) |
Apr
(74) |
May
(53) |
Jun
(40) |
Jul
(519) |
Aug
(151) |
Sep
(132) |
Oct
(74) |
Nov
(282) |
Dec
(190) |
| 2008 |
Jan
(141) |
Feb
(67) |
Mar
(69) |
Apr
(96) |
May
(227) |
Jun
(404) |
Jul
(399) |
Aug
(96) |
Sep
(120) |
Oct
(205) |
Nov
(126) |
Dec
(261) |
| 2009 |
Jan
(136) |
Feb
(136) |
Mar
(119) |
Apr
(124) |
May
(155) |
Jun
(98) |
Jul
(136) |
Aug
(292) |
Sep
(174) |
Oct
(126) |
Nov
(126) |
Dec
(79) |
| 2010 |
Jan
(109) |
Feb
(83) |
Mar
(139) |
Apr
(91) |
May
(79) |
Jun
(164) |
Jul
(184) |
Aug
(146) |
Sep
(163) |
Oct
(128) |
Nov
(70) |
Dec
(73) |
| 2011 |
Jan
(235) |
Feb
(165) |
Mar
(147) |
Apr
(86) |
May
(74) |
Jun
(118) |
Jul
(65) |
Aug
(75) |
Sep
(162) |
Oct
(94) |
Nov
(48) |
Dec
(44) |
| 2012 |
Jan
(49) |
Feb
(40) |
Mar
(88) |
Apr
(35) |
May
(52) |
Jun
(69) |
Jul
(90) |
Aug
(123) |
Sep
(112) |
Oct
(120) |
Nov
(105) |
Dec
(116) |
| 2013 |
Jan
(76) |
Feb
(26) |
Mar
(78) |
Apr
(43) |
May
(61) |
Jun
(53) |
Jul
(147) |
Aug
(85) |
Sep
(83) |
Oct
(122) |
Nov
(18) |
Dec
(27) |
| 2014 |
Jan
(58) |
Feb
(25) |
Mar
(49) |
Apr
(17) |
May
(29) |
Jun
(39) |
Jul
(53) |
Aug
(52) |
Sep
(35) |
Oct
(47) |
Nov
(110) |
Dec
(27) |
| 2015 |
Jan
(50) |
Feb
(93) |
Mar
(96) |
Apr
(30) |
May
(55) |
Jun
(83) |
Jul
(44) |
Aug
(8) |
Sep
(5) |
Oct
|
Nov
(1) |
Dec
(1) |
| 2016 |
Jan
|
Feb
|
Mar
(1) |
Apr
|
May
|
Jun
(2) |
Jul
|
Aug
(3) |
Sep
(1) |
Oct
(3) |
Nov
|
Dec
|
| 2017 |
Jan
|
Feb
(5) |
Mar
|
Apr
|
May
|
Jun
|
Jul
(3) |
Aug
|
Sep
(7) |
Oct
|
Nov
|
Dec
|
| 2018 |
Jan
|
Feb
|
Mar
|
Apr
|
May
|
Jun
|
Jul
(2) |
Aug
|
Sep
|
Oct
|
Nov
|
Dec
|
|
From: Todd <tod...@gm...> - 2015-02-28 22:50:42
|
On Feb 19, 2015 1:39 AM, "Nathaniel Smith" <nj...@po...> wrote: > > On Feb 16, 2015 3:39 PM, "Eric Firing" <ef...@ha...> wrote: > > > > On 2015/02/16 1:29 PM, Michael Waskom wrote: > > > > > Nathaniel's January 9 message in that thread (can't figure out how to > > > link to it in the archives) had a suggestion that I thought was very > > > promising, to do something similar to Parula but rotate around the hue > > > circle the other direction so that the hues would go blue - purple - red > > > - yellow. I don't think we've seen an example of exactly what it would > > > look like, but I reckon it would be similar to the middle colormap here > > > http://earthobservatory.nasa.gov/blogs/elegantfigures/files/2013/08/three_perceptual_palettes_618.png > > > (from the elegant figures block series linked above), which I've always > > > found quite attractive. > > > > Certainly it can be considered--but we have to have a real implementation. > > While I hate to promise vaporware, I actually was planning to have a > go at implementing such a colormap in the next few weeks, based on > optimizing the same set of parameters that viscm visualizes... FWIW. > > Are we planning to make other default appearance changes at the same > time? The idea of changing the color cycle and/or dot-dash cycle has > already come up in this thread, and this earlier thread proposed > several more good ideas [1]: > http://thread.gmane.org/gmane.comp.python.matplotlib.devel/13128/focus=13166 > If the goal is still to put all the appearance-related changes in a single release (to simplify changes to downstream unit tests), but nobody has stepped up to make changes except to the colors, might it be possible to just adopt the default seaborn style (except for colors, of course)? If anybody is strongly motivated to make changes they can, but if nobody does there would still be a good, modern, pleasant-looking style used by default. |
|
From: Benjamin R. <ben...@ou...> - 2015-02-28 14:46:59
|
It sounds like you are on the right path, and you do raise some interesting points. I would certainly be open to accepting improvements to the animation framework to facilitate this work. As for the gray vs. white backgrounds, I am not all that familiar with how that is handled, but IIRC, the non-interactive backends obtain the background color from the rcparams. I would love to see a PR for your efforts so far. An SVG animator would also be valuable as a way to add unit-tests to the animation framework since it would be easier to do comparisons, I would think. On Fri, Feb 27, 2015 at 11:09 AM, tbhartman <tbh...@gm...> wrote: > I trust this is an appropriate place; this is my first time on this > listserv. > > I want to add the ability to export an animation in SVG format so that I > have a vectorized animation. From what I've been able to discern, this > hasn't been done yet. I may have many questions related to this, so if > someone is familiar with this section of the code and would be able to > answer additional questions in the future, please let me know. > > My first hurdle is how to extract each frame of the animation. I believe I > need to make a new class and inherit MovieWriter. However, MovieWriter is > setup to write an image to a file for each frame, then stitch those images > together (through a pipe to an external tool). But in order to add > animation to the SVG, it will be much easier for me to have an XML tree as > an object for each frame, rather than an XML file, so that I do not need to > re-parse the XML. > > Here is where I am at: > * I've modified backend_svg.py: > - an XMLBuilder class now builds the tree from the renderer (previously, > the XML data was written directly through XMLWriter) > - currently, I have the svg backend (mostly) backward compatible so that > I > can write images to file in the normal way. I have not run the example > tests yet, but need to eventually. > - I added a draw method to FigureCanvasSVG which returns the XML tree > * I've modified animation.py: > - added SVGWriter class which inherits MovieWriter > - SVGWriter modifies setup method so that an external process is not > started > - SVGWriter.grab_frame method grabs the XML tree (rather than printing to > a file) via FigureCanvasSVG.draw > - SVGWriter.cleanup goes through the XML trees and adds 'set' XML > elements > to create the animation > * basically I copy the main group of each frame to a new XML tree and > make it's "opacity" CSS attribute 1 for the duration of that frame. It is > a > hack to get the rest working...I'd like to actually go into the tree and > only change the data that changes in each frame. > > I am at the point where I can get an SVG animation out of the moviewriter > example at: > > http://matplotlib.org/examples/animation/moviewriter.html > > However, FigureCanvas.draw does not seem the appropriate place for this. > Case in point, the background is the default gray rather than white (which > you get if you savefig). Any thoughts on the best way to do this? > > -Tim > > > > > -- > View this message in context: > http://matplotlib.1069221.n5.nabble.com/animation-in-SVG-tp45021.html > Sent from the matplotlib - devel mailing list archive at Nabble.com. > > > ------------------------------------------------------------------------------ > Dive into the World of Parallel Programming The Go Parallel Website, > sponsored > by Intel and developed in partnership with Slashdot Media, is your hub for > all > things parallel software development, from weekly thought leadership blogs > to > news, videos, case studies, tutorials and more. Take a look and join the > conversation now. http://goparallel.sourceforge.net/ > _______________________________________________ > Matplotlib-devel mailing list > Mat...@li... > https://lists.sourceforge.net/lists/listinfo/matplotlib-devel > |
|
From: tbhartman <tbh...@gm...> - 2015-02-27 16:09:51
|
I trust this is an appropriate place; this is my first time on this listserv.

I want to add the ability to export an animation in SVG format so that I
have a vectorized animation.  From what I've been able to discern, this
hasn't been done yet.  I may have many questions related to this, so if
someone is familiar with this section of the code and would be able to
answer additional questions in the future, please let me know.

My first hurdle is how to extract each frame of the animation.  I believe I
need to make a new class and inherit MovieWriter.  However, MovieWriter is
setup to write an image to a file for each frame, then stitch those images
together (through a pipe to an external tool).  But in order to add
animation to the SVG, it will be much easier for me to have an XML tree as
an object for each frame, rather than an XML file, so that I do not need to
re-parse the XML.

Here is where I am at:
* I've modified backend_svg.py:
  - an XMLBuilder class now builds the tree from the renderer (previously,
the XML data was written directly through XMLWriter)
  - currently, I have the svg backend (mostly) backward compatible so that I
can write images to file in the normal way.  I have not run the example
tests yet, but need to eventually.
  - I added a draw method to FigureCanvasSVG which returns the XML tree
* I've modified animation.py:
  - added SVGWriter class which inherits MovieWriter
  - SVGWriter modifies setup method so that an external process is not
started
  - SVGWriter.grab_frame method grabs the XML tree (rather than printing to
a file) via FigureCanvasSVG.draw
  - SVGWriter.cleanup goes through the XML trees and adds 'set' XML elements
to create the animation
    * basically I copy the main group of each frame to a new XML tree and
make it's "opacity" CSS attribute 1 for the duration of that frame.  It is a
hack to get the rest working...I'd like to actually go into the tree and
only change the data that changes in each frame.

I am at the point where I can get an SVG animation out of the moviewriter
example at:

http://matplotlib.org/examples/animation/moviewriter.html

However, FigureCanvas.draw does not seem the appropriate place for this.
Case in point, the background is the default gray rather than white (which
you get if you savefig).  Any thoughts on the best way to do this?

-Tim


--
View this message in context: http://matplotlib.1069221.n5.nabble.com/animation-in-SVG-tp45021.html
Sent from the matplotlib - devel mailing list archive at Nabble.com.
|
|
From: Thomas C. <tca...@gm...> - 2015-02-23 23:06:53
|
This should probably be changed to use the new and improved container class (along with error bar), but I should read the code to be sure. On Mon, Feb 23, 2015, 11:44 Benjamin Root <ben...@ou...> wrote: > Huh, how about that. ContourSet subclasses ScalarMappable, but not Artist. > I don't know if that is intentional or not, but given that most plotting > functions return artists, this would seem to be an anomaly. FuncAnimation > expects a list of Artists. Since QuadContourSet is (apparently) not an > Artist, then that is why it isn't working quite right. > > As for blitting, I doubt you are going to need it here. Blitting is really > only advantagous if the computation/draw time of the animated portion is > comparable to the computation/draw time of the unanimated portion. > Contouring tends to be time-consuming (relatively speaking), so I doubt you > will gain much benefit from blitting it. > > Ben Root > > On Mon, Feb 23, 2015 at 8:53 AM, Ignat Harczuk <ig...@gm...> wrote: > >> Firstly I would like to apologize in case this should belong in the >> matplotlib-users, I'm not sure if this is dev or users related. >> >> >> Let us say we want to animate a 2D contour plot, then passing the blit = >> True argument to FuncAnimation fails since the QuadContourSet has no axes >> attribute. >> >> Is it for some specific it is implemented like this? And maybe there a >> hack to get this to work? >> >> A working code example with the actually wanted one commented out. >> >> import numpy as np >> import matplotlib.animation as animation >> from matplotlib import pyplot as plt >> >> fig, ax = plt.subplots() >> >> x = np.linspace( -np.pi, np.pi, 50 ) >> y = np.linspace( -np.pi, np.pi, 50 ) >> X, Y = np.meshgrid( x, y ) >> Z = np.zeros( X.shape ) >> >> def init(): >> cont = ax.contourf( X, Y, Z ) >> cbar = plt.colorbar( cont ) >> return cont, >> >> def animate( t ): >> k = np.array( [1,1] ) >> omega = 0.5 >> >> x = np.linspace( -np.pi, np.pi, 50 ) >> y = np.linspace( -np.pi, np.pi, 50 ) >> X, Y = np.meshgrid( x, y ) >> Z = np.exp( 1j * (omega* t - X*k[0] ) ) * np.exp( - 1j * k[1]*Y ) >> cont = ax.contourf( X, Y, Z ) >> return cont, >> >> #ani = animation.FuncAnimation( fig, animate, frames = 100, interval = 1, >> repeat = False, blit = True, init_func = init,) >> ani = animation.FuncAnimation( fig, animate, frames = 100, interval = 1, >> repeat = False, init_func = init,) >> plt.show() >> >> >> >> ------------------------------------------------------------------------------ >> Download BIRT iHub F-Type - The Free Enterprise-Grade BIRT Server >> from Actuate! Instantly Supercharge Your Business Reports and Dashboards >> with Interactivity, Sharing, Native Excel Exports, App Integration & more >> Get technology previously reserved for billion-dollar corporations, FREE >> >> http://pubads.g.doubleclick.net/gampad/clk?id=190641631&iu=/4140/ostg.clktrk >> _______________________________________________ >> Matplotlib-devel mailing list >> Mat...@li... >> https://lists.sourceforge.net/lists/listinfo/matplotlib-devel >> >> > ------------------------------------------------------------ > ------------------ > Download BIRT iHub F-Type - The Free Enterprise-Grade BIRT Server > from Actuate! Instantly Supercharge Your Business Reports and Dashboards > with Interactivity, Sharing, Native Excel Exports, App Integration & more > Get technology previously reserved for billion-dollar corporations, FREE > http://pubads.g.doubleclick.net/gampad/clk?id=190641631& > iu=/4140/ostg.clktrk_______________________________________________ > Matplotlib-devel mailing list > Mat...@li... > https://lists.sourceforge.net/lists/listinfo/matplotlib-devel > |
|
From: Eric F. <ef...@ha...> - 2015-02-23 18:46:21
|
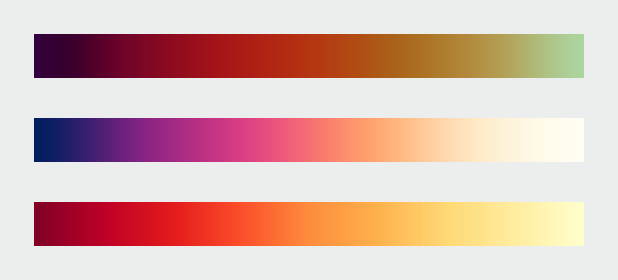
On 2015/02/18 2:39 PM, Nathaniel Smith wrote: > On Feb 16, 2015 3:39 PM, "Eric Firing" <ef...@ha...> wrote: >> >> On 2015/02/16 1:29 PM, Michael Waskom wrote: >> >>> Nathaniel's January 9 message in that thread (can't figure out how to >>> link to it in the archives) had a suggestion that I thought was very >>> promising, to do something similar to Parula but rotate around the hue >>> circle the other direction so that the hues would go blue - purple - red >>> - yellow. I don't think we've seen an example of exactly what it would >>> look like, but I reckon it would be similar to the middle colormap here >>> http://earthobservatory.nasa.gov/blogs/elegantfigures/files/2013/08/three_perceptual_palettes_618.png >>> (from the elegant figures block series linked above), which I've always >>> found quite attractive. >> >> Certainly it can be considered--but we have to have a real implementation. > > While I hate to promise vaporware, I actually was planning to have a > go at implementing such a colormap in the next few weeks, based on > optimizing the same set of parameters that viscm visualizes... FWIW. It might be worth quite a bit--and the sooner, the better. > > Are we planning to make other default appearance changes at the same > time? The idea of changing the color cycle and/or dot-dash cycle has > already come up in this thread, and this earlier thread proposed > several more good ideas [1]: > http://thread.gmane.org/gmane.comp.python.matplotlib.devel/13128/focus=13166 Thank you for the link. The ideas certainly deserve review at this point. There is some danger in that the more things we try to change, the harder it might be to approach consensus. > > I agree that now is definitely the time to get serious about making > these changes, but it seems like there's enough to be worked out that > sticking to the original plan and keeping mainline quasi-frozen until > 2.0 is ready might create frustration and hasty decisions. Maybe it > would be less stressful all around if we let mainline development > proceed at whatever pace makes sense while these things get sorted > out, and then once the appearance changes are ready make the call > about whether to cut a quick 1.5 first or not? Presumably these > defaults will stick around for many years so it's worth taking a few > months to get a complete proposal together, get feedback, etc., IMO. Good point; this can work provided we can keep the momentum up, so that we actually converge on a feasible proposal. > > In an ideal world version 1.last might even provide a > style.use("matplotlib2") command to preview what 2.0 will do, just > like 2.0 will presumably have a style.use("matplotlib1") command for > those who want to (temporarily) revert. I like this style-based preview idea. Eric > > -n > > [1] well I would think that wouldn't I ;-) > |
|
From: Benjamin R. <ben...@ou...> - 2015-02-23 18:39:14
|
My eyes are definitely favoring the L20-80 over the L5-95 colormaps. Does Luminosity take into account human's non-linearity in perceiving brightness? I remember a few years ago many of the open-source graphics tools (such as GIMP) had to be fixed because it assumed a linear brightness perception. IIRC, humans are better at perceiving brightness gradients on one end of the range than on the other end. On Mon, Feb 23, 2015 at 1:30 PM, Eric Firing <ef...@ha...> wrote: > On 2015/02/23 8:16 AM, Benjamin Root wrote: > > Interesting choices, and I think we are on the right paths (no pun > > intended) through the two possible colors. However, I think the same > > problem arises that I noted before. Both ends of the colormap are nearly > > black to nearly white. IIRC, our perception of luminosity has a much > > greater range than it does for chroma. While it is nice to take > > advantage of that, I wonder if we are going too far in the luminosity > > range? Perhaps these colormaps would be better if the luminosity range > > wasn't as full as it is here? > > > > Ben Root > > Ben, > > I was noticing the same thing, except that at least on my screen, the > problem is mainly at the dark end, and it varies with the actual set of > control points. The very last one, for example (Purple Red Yellow > L5-95) has what looks like a fairly linear ramp from end to end on my > screen, while "Blue Green Yellow L10-90" lacks contrast on the dark end. > I suspect all this will be quite dependent on the particular screen > (or printer--including the whole chain of color conversions ending up in > ink or toner dots) being used. It doesn't look to me like a problem > with the luminosity range as such. We have a highly nonlinear problem > here. > > In any case, this looks like a nice tool. Maybe it can be combined with > Nathaniel's code, which shows other aspects of the colormap? > > Eric > > > ------------------------------------------------------------------------------ > Download BIRT iHub F-Type - The Free Enterprise-Grade BIRT Server > from Actuate! Instantly Supercharge Your Business Reports and Dashboards > with Interactivity, Sharing, Native Excel Exports, App Integration & more > Get technology previously reserved for billion-dollar corporations, FREE > > http://pubads.g.doubleclick.net/gampad/clk?id=190641631&iu=/4140/ostg.clktrk > _______________________________________________ > Matplotlib-devel mailing list > Mat...@li... > https://lists.sourceforge.net/lists/listinfo/matplotlib-devel > |
|
From: Eric F. <ef...@ha...> - 2015-02-23 18:30:40
|
On 2015/02/23 8:16 AM, Benjamin Root wrote: > Interesting choices, and I think we are on the right paths (no pun > intended) through the two possible colors. However, I think the same > problem arises that I noted before. Both ends of the colormap are nearly > black to nearly white. IIRC, our perception of luminosity has a much > greater range than it does for chroma. While it is nice to take > advantage of that, I wonder if we are going too far in the luminosity > range? Perhaps these colormaps would be better if the luminosity range > wasn't as full as it is here? > > Ben Root Ben, I was noticing the same thing, except that at least on my screen, the problem is mainly at the dark end, and it varies with the actual set of control points. The very last one, for example (Purple Red Yellow L5-95) has what looks like a fairly linear ramp from end to end on my screen, while "Blue Green Yellow L10-90" lacks contrast on the dark end. I suspect all this will be quite dependent on the particular screen (or printer--including the whole chain of color conversions ending up in ink or toner dots) being used. It doesn't look to me like a problem with the luminosity range as such. We have a highly nonlinear problem here. In any case, this looks like a nice tool. Maybe it can be combined with Nathaniel's code, which shows other aspects of the colormap? Eric |
|
From: Benjamin R. <ben...@ou...> - 2015-02-23 18:16:57
|
Interesting choices, and I think we are on the right paths (no pun intended) through the two possible colors. However, I think the same problem arises that I noted before. Both ends of the colormap are nearly black to nearly white. IIRC, our perception of luminosity has a much greater range than it does for chroma. While it is nice to take advantage of that, I wonder if we are going too far in the luminosity range? Perhaps these colormaps would be better if the luminosity range wasn't as full as it is here? Ben Root On Mon, Feb 23, 2015 at 12:36 PM, Pierre Haessig <pie...@cr...> wrote: > Hi, > > Le 16/02/2015 23:01, Eric Firing a écrit : > > For a long time there has been discussion of replacing the matplotlib > > default color map [...] > I've started building a small interactive Lab point editor to build a > sequential colormap. > https://github.com/pierre-haessig/lab-colormap-creator > > The main interest of it is the ability to quickly check that the points > stay in the sRGB gamut. > > There are some colormap results I just got this afternoon with it in the > companion notebook > ( > http://nbviewer.ipython.org/github/pierre-haessig/lab-colormap-creator/blob/master/test_plots.ipynb > ) > > It feels there are indeed only two routes: the Blue-Green-Yellow and the > Blue-Red-Yellow one. Maybe it is possible to squeeze in a more "snaky" > path, but it might look weird. > > best, > Pierre > > > > ------------------------------------------------------------------------------ > Download BIRT iHub F-Type - The Free Enterprise-Grade BIRT Server > from Actuate! Instantly Supercharge Your Business Reports and Dashboards > with Interactivity, Sharing, Native Excel Exports, App Integration & more > Get technology previously reserved for billion-dollar corporations, FREE > > http://pubads.g.doubleclick.net/gampad/clk?id=190641631&iu=/4140/ostg.clktrk > _______________________________________________ > Matplotlib-devel mailing list > Mat...@li... > https://lists.sourceforge.net/lists/listinfo/matplotlib-devel > > |
|
From: Pierre H. <pie...@cr...> - 2015-02-23 17:54:37
|
Hi, Le 16/02/2015 23:01, Eric Firing a écrit : > For a long time there has been discussion of replacing the matplotlib > default color map [...] I've started building a small interactive Lab point editor to build a sequential colormap. https://github.com/pierre-haessig/lab-colormap-creator The main interest of it is the ability to quickly check that the points stay in the sRGB gamut. There are some colormap results I just got this afternoon with it in the companion notebook (http://nbviewer.ipython.org/github/pierre-haessig/lab-colormap-creator/blob/master/test_plots.ipynb) It feels there are indeed only two routes: the Blue-Green-Yellow and the Blue-Red-Yellow one. Maybe it is possible to squeeze in a more "snaky" path, but it might look weird. best, Pierre |
|
From: Benjamin R. <ben...@ou...> - 2015-02-23 16:43:46
|
Huh, how about that. ContourSet subclasses ScalarMappable, but not Artist. I don't know if that is intentional or not, but given that most plotting functions return artists, this would seem to be an anomaly. FuncAnimation expects a list of Artists. Since QuadContourSet is (apparently) not an Artist, then that is why it isn't working quite right. As for blitting, I doubt you are going to need it here. Blitting is really only advantagous if the computation/draw time of the animated portion is comparable to the computation/draw time of the unanimated portion. Contouring tends to be time-consuming (relatively speaking), so I doubt you will gain much benefit from blitting it. Ben Root On Mon, Feb 23, 2015 at 8:53 AM, Ignat Harczuk <ig...@gm...> wrote: > Firstly I would like to apologize in case this should belong in the > matplotlib-users, I'm not sure if this is dev or users related. > > > Let us say we want to animate a 2D contour plot, then passing the blit = > True argument to FuncAnimation fails since the QuadContourSet has no axes > attribute. > > Is it for some specific it is implemented like this? And maybe there a > hack to get this to work? > > A working code example with the actually wanted one commented out. > > import numpy as np > import matplotlib.animation as animation > from matplotlib import pyplot as plt > > fig, ax = plt.subplots() > > x = np.linspace( -np.pi, np.pi, 50 ) > y = np.linspace( -np.pi, np.pi, 50 ) > X, Y = np.meshgrid( x, y ) > Z = np.zeros( X.shape ) > > def init(): > cont = ax.contourf( X, Y, Z ) > cbar = plt.colorbar( cont ) > return cont, > > def animate( t ): > k = np.array( [1,1] ) > omega = 0.5 > > x = np.linspace( -np.pi, np.pi, 50 ) > y = np.linspace( -np.pi, np.pi, 50 ) > X, Y = np.meshgrid( x, y ) > Z = np.exp( 1j * (omega* t - X*k[0] ) ) * np.exp( - 1j * k[1]*Y ) > cont = ax.contourf( X, Y, Z ) > return cont, > > #ani = animation.FuncAnimation( fig, animate, frames = 100, interval = 1, > repeat = False, blit = True, init_func = init,) > ani = animation.FuncAnimation( fig, animate, frames = 100, interval = 1, > repeat = False, init_func = init,) > plt.show() > > > > ------------------------------------------------------------------------------ > Download BIRT iHub F-Type - The Free Enterprise-Grade BIRT Server > from Actuate! Instantly Supercharge Your Business Reports and Dashboards > with Interactivity, Sharing, Native Excel Exports, App Integration & more > Get technology previously reserved for billion-dollar corporations, FREE > > http://pubads.g.doubleclick.net/gampad/clk?id=190641631&iu=/4140/ostg.clktrk > _______________________________________________ > Matplotlib-devel mailing list > Mat...@li... > https://lists.sourceforge.net/lists/listinfo/matplotlib-devel > > |
|
From: Ignat H. <ig...@gm...> - 2015-02-23 13:53:46
|
Firstly I would like to apologize in case this should belong in the
matplotlib-users, I'm not sure if this is dev or users related.


Let us say we want to animate a 2D contour plot, then passing the blit =
True argument to FuncAnimation fails since the QuadContourSet has no axes
attribute.

Is it for some specific it is implemented like this? And maybe there a hack
to get this to work?

A working code example with the actually wanted one commented out.

import numpy as np
import matplotlib.animation as animation
from matplotlib import pyplot as plt

fig, ax = plt.subplots()

x = np.linspace( -np.pi, np.pi, 50 )
y = np.linspace( -np.pi, np.pi, 50 )
X, Y = np.meshgrid( x, y )
Z = np.zeros( X.shape )

def init():
    cont = ax.contourf( X, Y, Z )
    cbar = plt.colorbar( cont )
    return cont,

def animate( t ):
    k = np.array( [1,1] )
    omega = 0.5

    x = np.linspace( -np.pi, np.pi, 50 )
    y = np.linspace( -np.pi, np.pi, 50 )
    X, Y = np.meshgrid( x, y )
    Z = np.exp( 1j * (omega* t - X*k[0] ) ) * np.exp( - 1j * k[1]*Y )
    cont = ax.contourf( X, Y, Z )
    return cont,

#ani = animation.FuncAnimation( fig, animate, frames = 100, interval = 1,
repeat = False, blit = True, init_func = init,)
ani = animation.FuncAnimation( fig, animate, frames = 100, interval = 1,
repeat = False,  init_func = init,)
plt.show()
|
|
From: Raniere S. <ra...@im...> - 2015-02-20 20:24:44
|
*Call for Proposals* *SciPy Latin América 2015*, the third annual Scientific Computing with Python Conference, will be held this *May 20-22* in *Posadas, Misiones, Argentina*. SciPy is a community dedicated to the advancement of scientific computing through open source Python software for mathematics, science, and engineering. The annual SciPy Conferences allows participants from academic, commercial, and governmental organizations to showcase their latest projects, learn from skilled users and developers, and collaborate on code development. *Proposals are now being accepted for SciPy Latin América 2015*. Presentation content can be at a novice, intermediate or advanced level. Talks will run 30-40 min and hands-on tutorials will run 100-120 min. We also receive proposal for posters. For more information about the different types of proposal, see below the "*Different types of Communication*" section. *How to Submit?* 1. Register for an account on http://conf.scipyla.org/user/register 2. Submit your proposal at http://conf.scipyla.org/activity/propose *Important Dates* - *April 6th*: Talks, poster, tutorial submission deadline. - *April 20th*: Notification Talks / Posters / Tutorial accepted. - *May 20th-22nd*: SciPy Latin América 2015. *Different types of Communication* *Talks*: These are the traditional talk sessions given during the main conference days. They're mostly 30 minutes long with 5 min for questions. If you think you have a topic but aren't sure how to propose it, contact our program committee and we'll work with you. We'd love to help you come up with a great proposal. *Tutorials*: We are looking for tutorials that can grow this community at any level. We aim for tutorials that will advance Scientific Python, advance this community, and shape the future. They're are 100-120 minutes long, but if you think you need more than one slot, you can split the content and submit two self-contained proposals. *Posters*: The poster session provides a more interactive, attendee-driven presentation than the speaker-driven conference talks. Poster presentations have fostered extensive discussions on the topics, with many that have gone on much longer than the actual "session" called for. The idea is to present your topic on poster board and as attendees mingle through the rows, they find your topic, read through what you've written, then strike up a discussion on it. It's as simple as that. You could be doing Q&A in the first minute of the session with a group of 10 people. *Lightning Talks*: Want to give a talk, but do not have enough material for a full talk? These talks are, at max, 5 minute talks done in quick succession in the main hall. No need to fill the whole slot, though! -- *The SciPy LA 2015 Program **Committee* |
|
From: Benjamin R. <ben...@ou...> - 2015-02-19 15:00:04
|
I would be +1 on this as well. Various command-line text extraction tools are near useless with the current state. On Thu, Feb 19, 2015 at 9:42 AM, Benjamin Reedlunn <bre...@gm...> wrote: > I am in favor of such a change. I also have rcParams['pdf.fonttype'] = > 42, so I can use Adobe Illustrator to tweak my mpl generated plots. > Changing a word in Illustrator becomes quite a pain when every glyph is a > separate text box. > > -Ben Reedlunn > > On Feb 18, 2015, at 8:52 AM, Eric Moore <ew...@re...> wrote: > > Hi, > > I posted on the user list a while back about saving editable text using > the postscript backend [1]. There I was informed that this was changed a > few years ago to individually place glyphs. It looks to me, that this > change was about correctly supporting unicode in this backend [2]. > > Would the project be open to changing this to produce text runs when all > of the characters are ascii? This way, the general unicode case should > still work but runs of text where the special handling is not necessary > should result in editable text. I'm happy to work up a patch, but I don't > want to spend the time if there is no hope of it being merged. > > My use case is to be able to make some tweaks to figures post mpl. In my > case this tends to be to either combine figures from several sources into a > single coherent figure or to adjust the figure size or spacing slightly so > the final figure fits into the space available. All of this can be done in > mpl directly, but in terms of effective use of my time, opening the figure > in Corel Draw, Inkscape or Illustrator is much faster since I can get the > figure 90% of the way there quickly and easily using mpl. > > Eric > > 1. http://thread.gmane.org/gmane.comp.python.matplotlib.general/34816 > 2. > https://github.com/matplotlib/matplotlib/commit/80321a3b489994748b79e41bc34a65f836a9a03f > > ------------------------------------------------------------------------------ > Download BIRT iHub F-Type - The Free Enterprise-Grade BIRT Server > from Actuate! Instantly Supercharge Your Business Reports and Dashboards > with Interactivity, Sharing, Native Excel Exports, App Integration & more > Get technology previously reserved for billion-dollar corporations, FREE > > http://pubads.g.doubleclick.net/gampad/clk?id=190641631&iu=/4140/ostg.clktrk_______________________________________________ > Matplotlib-devel mailing list > Mat...@li... > https://lists.sourceforge.net/lists/listinfo/matplotlib-devel > > > > > ------------------------------------------------------------------------------ > Download BIRT iHub F-Type - The Free Enterprise-Grade BIRT Server > from Actuate! Instantly Supercharge Your Business Reports and Dashboards > with Interactivity, Sharing, Native Excel Exports, App Integration & more > Get technology previously reserved for billion-dollar corporations, FREE > > http://pubads.g.doubleclick.net/gampad/clk?id=190641631&iu=/4140/ostg.clktrk > _______________________________________________ > Matplotlib-devel mailing list > Mat...@li... > https://lists.sourceforge.net/lists/listinfo/matplotlib-devel > > |
|
From: Benjamin R. <bre...@gm...> - 2015-02-19 14:42:40
|
I am in favor of such a change. I also have rcParams['pdf.fonttype'] = 42, so I can use Adobe Illustrator to tweak my mpl generated plots. Changing a word in Illustrator becomes quite a pain when every glyph is a separate text box. -Ben Reedlunn On Feb 18, 2015, at 8:52 AM, Eric Moore <ew...@re...> wrote: > Hi, > > I posted on the user list a while back about saving editable text using the postscript backend [1]. There I was informed that this was changed a few years ago to individually place glyphs. It looks to me, that this change was about correctly supporting unicode in this backend [2]. > > Would the project be open to changing this to produce text runs when all of the characters are ascii? This way, the general unicode case should still work but runs of text where the special handling is not necessary should result in editable text. I'm happy to work up a patch, but I don't want to spend the time if there is no hope of it being merged. > > My use case is to be able to make some tweaks to figures post mpl. In my case this tends to be to either combine figures from several sources into a single coherent figure or to adjust the figure size or spacing slightly so the final figure fits into the space available. All of this can be done in mpl directly, but in terms of effective use of my time, opening the figure in Corel Draw, Inkscape or Illustrator is much faster since I can get the figure 90% of the way there quickly and easily using mpl. > > Eric > > 1. http://thread.gmane.org/gmane.comp.python.matplotlib.general/34816 > 2. https://github.com/matplotlib/matplotlib/commit/80321a3b489994748b79e41bc34a65f836a9a03f > ------------------------------------------------------------------------------ > Download BIRT iHub F-Type - The Free Enterprise-Grade BIRT Server > from Actuate! Instantly Supercharge Your Business Reports and Dashboards > with Interactivity, Sharing, Native Excel Exports, App Integration & more > Get technology previously reserved for billion-dollar corporations, FREE > http://pubads.g.doubleclick.net/gampad/clk?id=190641631&iu=/4140/ostg.clktrk_______________________________________________ > Matplotlib-devel mailing list > Mat...@li... > https://lists.sourceforge.net/lists/listinfo/matplotlib-devel |
|
From: Raniere S. <ra...@im...> - 2015-02-19 12:05:54
|
Hi,

NumFOCUS has promotes and supports the ongoing research and development of
open-source computing tools including Matplotlib.

This year NumFOCUS want to try be a Google Summer of Code
"umbrella" mentoring organization,

    Umbrella organizations are mentoring organizations accepted into the Google
    Summer of Code program that have other open source organizations working
    "under" them. Sometime organizations that work very closely or have very
    similar goals or communities may get put together under an "umbrella."
    Google stills expects all organizations under the umbrella, whether accepted
    into the program under their title or not, to adhere to all the rules and
    regulations of the program.

    From https://www.google-melange.com/gsoc/document/show/gsoc_program/google/gsoc2015/help_page#umbrella_organization

To help promote and support Matplotlib.

We encourage Matplotlib to apply to Google Summer of Code under your own title
and will be very happy if you can also do with us.
If you are interested, please check https://github.com/swcarpentry/gsoc2015
and https://github.com/swcarpentry/gsoc2015/blob/master/CONTRIBUTING.md.

If you have any question, please email me directly.

Thanks in advance,
Raniere
|
|
From: Michael W. <mw...@st...> - 2015-02-19 01:47:20
|
On Wed, Feb 18, 2015 at 5:23 PM, Eric Firing <ef...@ha...> wrote: > > Do you think there is a way to make a sequential map that is more pleasing > to those of us who are more comfortable with blues and greens than with the > slightly muddy purples and browns in the initial attempt at HCL? Just to be clear, Hcl is just a color space; you could in principle make any number of colormaps using it. My particular proposal is to do something cubehelix-like in Hcl space while aiming for around .5-.75 of a rotation around the color wheel. What motivated the particular parameters in the original proposal was two things: a) Starting with blue and ending with yellow makes sense, because you can get good saturation out of dark blues and light yellows b) Once you have those endpoints, you can either go through green (this is what matlab does with parula) or through purple and red. the latter has the functional advantage of getting a bit more hue variation, and it also distinguishes the colormap from parula. I think this was the argument Nathaniel originally made. Tastes differ, but I find the blue-purple-red-yellow colormap quite attractive, (perhaps because it reminds me of the sunset. Actually, as an aside, your speculation that your aesthetic preferences are driven by positive associations by things that have those colors has some support in the psych literature: http://www.pnas.org/content/107/19/8877.full) Anyway, within the constraints of the "increase lightness and chroma linearly while circling around the hue wheel", it's easy to create a blue-green-yellow colormap: And also more generally, once you have a way of making a colormap from a few parameters, and some objective function for what makes a colormap "good", you can optimize in more principled ways than just playing around with the knobs of a widget. I believe this is what Nathaniel was proposing, and it sounds like a good idea. I would suggest that you folks (i.e. the matplotlib core developers) figure out earlier, rather than later, how the actual decision is going to be made. I think you can get pretty far with principled arguments, but ultimately there's going to be an aesthetic aspect and the decision will easily devolve some people thinking option A is "ugly" and other people thinking option B is "ugly". And that will be annoying for everyone involved, but particularly for the people who put time into developing candidates. |
|
From: Eric F. <ef...@ha...> - 2015-02-19 01:23:15
|
On 2015/02/18 2:39 PM, Nathaniel Smith wrote: > On Feb 16, 2015 3:39 PM, "Eric Firing" <ef...@ha...> wrote: >> >> On 2015/02/16 1:29 PM, Michael Waskom wrote: >> >>> Nathaniel's January 9 message in that thread (can't figure out how to >>> link to it in the archives) had a suggestion that I thought was very >>> promising, to do something similar to Parula but rotate around the hue >>> circle the other direction so that the hues would go blue - purple - red >>> - yellow. I don't think we've seen an example of exactly what it would >>> look like, but I reckon it would be similar to the middle colormap here >>> http://earthobservatory.nasa.gov/blogs/elegantfigures/files/2013/08/three_perceptual_palettes_618.png >>> (from the elegant figures block series linked above), which I've always >>> found quite attractive. >> >> Certainly it can be considered--but we have to have a real implementation. > > While I hate to promise vaporware, I actually was planning to have a > go at implementing such a colormap in the next few weeks, based on > optimizing the same set of parameters that viscm visualizes... FWIW. Do you think there is a way to make a sequential map that is more pleasing to those of us who are more comfortable with blues and greens than with the slightly muddy purples and browns in the initial attempt at HCL? > > Are we planning to make other default appearance changes at the same > time? The idea of changing the color cycle and/or dot-dash cycle has > already come up in this thread, and this earlier thread proposed > several more good ideas [1]: > http://thread.gmane.org/gmane.comp.python.matplotlib.devel/13128/focus=13166 My thought was to just change the color cycle, but other style aspects are by no means out of the question. Thank you for pointing out that thread. > > I agree that now is definitely the time to get serious about making > these changes, but it seems like there's enough to be worked out that > sticking to the original plan and keeping mainline quasi-frozen until > 2.0 is ready might create frustration and hasty decisions. Maybe it > would be less stressful all around if we let mainline development > proceed at whatever pace makes sense while these things get sorted > out, and then once the appearance changes are ready make the call > about whether to cut a quick 1.5 first or not? Presumably these > defaults will stick around for many years so it's worth taking a few > months to get a complete proposal together, get feedback, etc., IMO. The problem is that we have years of experience of no change, no decisions, no convergence of opinion. More recently we have had general agreement that a change is in order, but we are sadly lacking in concrete proposals. I certainly don't want to see a bad decision made, but without considerable prodding, it seems most likely that this will drag on for years. We need to make a change that is good; "perfect" is unattainable. > > In an ideal world version 1.last might even provide a > style.use("matplotlib2") command to preview what 2.0 will do, just > like 2.0 will presumably have a style.use("matplotlib1") command for > those who want to (temporarily) revert. This is a good idea--but even for this, we need actual style files. Eric > > -n > > [1] well I would think that wouldn't I ;-) > |
|
From: Eric F. <ef...@ha...> - 2015-02-19 01:08:52
|
On 2015/02/18 2:42 PM, Olga Botvinnik wrote: > FYI the notebook isn't working for me in IPython 2.2.0 > > I agree with Michael's sentiment that from a marketing perspective, a > matplotlib-only colormap is advantageous to maintain a consistent brand. Provided we can find a good colormap for that purpose; right now the only sequential proposals are gray, YlGnBu, and Michael's new HCL. Aesthetically, I find boring old YlGnBu the most pleasant of this small set. I agree with Michael's point that its yellow end might be lighter than optimum. To me, the HCL map is not downright ugly, but its definitely not appealing, either. My guess is that the prevalence of blues and greens in nature makes it easier for many people, myself included, to react favorably to large expanses of those colors for long periods of time. > > Will these colormaps also be used for non-imshow/colormesh/pcolormesh > data, as in for line colors as well? I think that's a great idea! It'll > make the black and white versions easier to understand since the > changing colors will monotonically increase/decrease in darkness rather > than randomly changing. I think that the line color cycling default should not match the default colormap at all; instead, it is in the "categorical" category, with visual ordering being secondary. All colors should be highly visible and distinguishable whether on a computer screen, paper, or projected by a poor projector in an overly lit room. Eric |
|
From: Thomas C. <tca...@gm...> - 2015-02-19 00:59:26
|
@Nathaniel I think developing the color-overhaul as a maintenance release is a decent compromise. All non-color changes get directed at the master branch and we can cherry-picked back bug-fixes as needed. The next feature release is planned for July/August, I _really_ hope sorting out the colors does not take that much longer. if we start to Paint a Bike Shed that just needs to be shut down. I am not sure how I feel about a _default_ non-trivial style-cycle. +1 on providing the machinery and rcparams to do it and agnostic which branch it goes on. @Olga I think there are two separate issues, the default color map used by ScalarMappable and the default color cycle that `ax.plot` and company use. I think both should be up for discussion and do not _need_ to use the same colors. Tom On Wed Feb 18 2015 at 7:43:31 PM Olga Botvinnik <obo...@uc...> wrote: > FYI the notebook isn't working for me in IPython 2.2.0 > > I agree with Michael's sentiment that from a marketing perspective, a > matplotlib-only colormap is advantageous to maintain a consistent brand. > > Will these colormaps also be used for non-imshow/colormesh/pcolormesh > data, as in for line colors as well? I think that's a great idea! It'll > make the black and white versions easier to understand since the changing > colors will monotonically increase/decrease in darkness rather than > randomly changing. > > RE: Nathaniel - I'm not as much of a fan of changing line styles in > addition to colors, but that's my personal preference for plotting lines > specifically. When plotting scatters, I think it does make sense, since the > room to perceive a change in color is so small, that a change in shape > helps too. > > On Wed Feb 18 2015 at 9:40:00 AM Michael Waskom <mw...@st...> > wrote: > >> I've made a second notebook that uses the IPython interactive machinery >> to let anyone play with the parameters and explore different ways of >> setting them. you can download the notebook with that here: >> http://nbviewer.ipython.org/gist/mwaskom/842d1497b6892d081bfb (I made it >> using IPython 3.0rc1; I'm not certain if it will work on the 2.x series; >> sorry if that is the case). >> >> This stays with the general approach in the original notebook of using a >> linear ramp for chroma, which again maybe is not what we want. But it >> should let you get a better sense for the parameter space. >> >> As I said in the email to Olga, I think (a) I would advocate fairly >> strongly that matplotlib should design a custom colormap as its default, >> and (b) I think this approach (a cubehelix-like map in Hcl space) is a >> principled way of doing so (though maybe not optimal). But both of those >> points are independent of whether you end up going with the particular >> parameters that I used to generate the original proposal -- I have my own >> domain on which to impose my personal aesthetic preferences, and I don't >> need to take over matplotlib too :) >> >> (But I do think it's worth distinguishing the matplotlib default from the >> matlab default.) >> >> Michael >> > ------------------------------------------------------------ >> ------------------ >> Download BIRT iHub F-Type - The Free Enterprise-Grade BIRT Server >> from Actuate! Instantly Supercharge Your Business Reports and Dashboards >> with Interactivity, Sharing, Native Excel Exports, App Integration & more >> Get technology previously reserved for billion-dollar corporations, FREE >> http://pubads.g.doubleclick.net/gampad/clk?id=190641631&iu=/ >> 4140/ostg.clktrk_______________________________________________ >> Matplotlib-devel mailing list >> Mat...@li... >> https://lists.sourceforge.net/lists/listinfo/matplotlib-devel >> > ------------------------------------------------------------ > ------------------ > Download BIRT iHub F-Type - The Free Enterprise-Grade BIRT Server > from Actuate! Instantly Supercharge Your Business Reports and Dashboards > with Interactivity, Sharing, Native Excel Exports, App Integration & more > Get technology previously reserved for billion-dollar corporations, FREE > http://pubads.g.doubleclick.net/gampad/clk?id=190641631&iu=/ > 4140/ostg.clktrk_______________________________________________ > Matplotlib-devel mailing list > Mat...@li... > https://lists.sourceforge.net/lists/listinfo/matplotlib-devel > |
|
From: Michael W. <mw...@st...> - 2015-02-19 00:57:02
|
On Wed, Feb 18, 2015 at 4:42 PM, Olga Botvinnik <obo...@uc...> wrote: > FYI the notebook isn't working for me in IPython 2.2.0 > Oops, sorry. > I agree with Michael's sentiment that from a marketing perspective, a > matplotlib-only colormap is advantageous to maintain a consistent brand. > Just to be clear, I wasn't suggesting *matplotlib only* in the (legal) sense that parula is matlab only, just that it should be identifiably "the matplotlib colormap". > Will these colormaps also be used for non-imshow/colormesh/pcolormesh > data, as in for line colors as well? I think that's a great idea! It'll > make the black and white versions easier to understand since the changing > colors will monotonically increase/decrease in darkness rather than > randomly changing. > I wasn't really thinking the plt.plot line cycle, more about plt.scatter, plt.contour, etc. and other places that accept a cmap argument but don't draw an "image-like" plot. Though, having a default colormap that can be used when you want to encode a quantitative value in the color of lines, e.g. the figures here: http://www.machenslab.org/publications/machens_etal_2010.pdf, would be good too. That's somewhere you often find people using jet. |
|
From: Olga B. <obo...@uc...> - 2015-02-19 00:42:56
|
FYI the notebook isn't working for me in IPython 2.2.0 I agree with Michael's sentiment that from a marketing perspective, a matplotlib-only colormap is advantageous to maintain a consistent brand. Will these colormaps also be used for non-imshow/colormesh/pcolormesh data, as in for line colors as well? I think that's a great idea! It'll make the black and white versions easier to understand since the changing colors will monotonically increase/decrease in darkness rather than randomly changing. RE: Nathaniel - I'm not as much of a fan of changing line styles in addition to colors, but that's my personal preference for plotting lines specifically. When plotting scatters, I think it does make sense, since the room to perceive a change in color is so small, that a change in shape helps too. On Wed Feb 18 2015 at 9:40:00 AM Michael Waskom <mw...@st...> wrote: > I've made a second notebook that uses the IPython interactive machinery to > let anyone play with the parameters and explore different ways of setting > them. you can download the notebook with that here: > http://nbviewer.ipython.org/gist/mwaskom/842d1497b6892d081bfb (I made it > using IPython 3.0rc1; I'm not certain if it will work on the 2.x series; > sorry if that is the case). > > This stays with the general approach in the original notebook of using a > linear ramp for chroma, which again maybe is not what we want. But it > should let you get a better sense for the parameter space. > > As I said in the email to Olga, I think (a) I would advocate fairly > strongly that matplotlib should design a custom colormap as its default, > and (b) I think this approach (a cubehelix-like map in Hcl space) is a > principled way of doing so (though maybe not optimal). But both of those > points are independent of whether you end up going with the particular > parameters that I used to generate the original proposal -- I have my own > domain on which to impose my personal aesthetic preferences, and I don't > need to take over matplotlib too :) > > (But I do think it's worth distinguishing the matplotlib default from the > matlab default.) > > Michael > ------------------------------------------------------------ > ------------------ > Download BIRT iHub F-Type - The Free Enterprise-Grade BIRT Server > from Actuate! Instantly Supercharge Your Business Reports and Dashboards > with Interactivity, Sharing, Native Excel Exports, App Integration & more > Get technology previously reserved for billion-dollar corporations, FREE > http://pubads.g.doubleclick.net/gampad/clk?id=190641631&iu=/ > 4140/ostg.clktrk_______________________________________________ > Matplotlib-devel mailing list > Mat...@li... > https://lists.sourceforge.net/lists/listinfo/matplotlib-devel > |
|
From: Nathaniel S. <nj...@po...> - 2015-02-19 00:39:15
|
On Feb 16, 2015 3:39 PM, "Eric Firing" <ef...@ha...> wrote: > > On 2015/02/16 1:29 PM, Michael Waskom wrote: > > > Nathaniel's January 9 message in that thread (can't figure out how to > > link to it in the archives) had a suggestion that I thought was very > > promising, to do something similar to Parula but rotate around the hue > > circle the other direction so that the hues would go blue - purple - red > > - yellow. I don't think we've seen an example of exactly what it would > > look like, but I reckon it would be similar to the middle colormap here > > http://earthobservatory.nasa.gov/blogs/elegantfigures/files/2013/08/three_perceptual_palettes_618.png > > (from the elegant figures block series linked above), which I've always > > found quite attractive. > > Certainly it can be considered--but we have to have a real implementation. While I hate to promise vaporware, I actually was planning to have a go at implementing such a colormap in the next few weeks, based on optimizing the same set of parameters that viscm visualizes... FWIW. Are we planning to make other default appearance changes at the same time? The idea of changing the color cycle and/or dot-dash cycle has already come up in this thread, and this earlier thread proposed several more good ideas [1]: http://thread.gmane.org/gmane.comp.python.matplotlib.devel/13128/focus=13166 I agree that now is definitely the time to get serious about making these changes, but it seems like there's enough to be worked out that sticking to the original plan and keeping mainline quasi-frozen until 2.0 is ready might create frustration and hasty decisions. Maybe it would be less stressful all around if we let mainline development proceed at whatever pace makes sense while these things get sorted out, and then once the appearance changes are ready make the call about whether to cut a quick 1.5 first or not? Presumably these defaults will stick around for many years so it's worth taking a few months to get a complete proposal together, get feedback, etc., IMO. In an ideal world version 1.last might even provide a style.use("matplotlib2") command to preview what 2.0 will do, just like 2.0 will presumably have a style.use("matplotlib1") command for those who want to (temporarily) revert. -n [1] well I would think that wouldn't I ;-) |
|
From: Michael W. <mw...@st...> - 2015-02-18 17:38:53
|
I've made a second notebook that uses the IPython interactive machinery to let anyone play with the parameters and explore different ways of setting them. you can download the notebook with that here: http://nbviewer.ipython.org/gist/mwaskom/842d1497b6892d081bfb (I made it using IPython 3.0rc1; I'm not certain if it will work on the 2.x series; sorry if that is the case). This stays with the general approach in the original notebook of using a linear ramp for chroma, which again maybe is not what we want. But it should let you get a better sense for the parameter space. As I said in the email to Olga, I think (a) I would advocate fairly strongly that matplotlib should design a custom colormap as its default, and (b) I think this approach (a cubehelix-like map in Hcl space) is a principled way of doing so (though maybe not optimal). But both of those points are independent of whether you end up going with the particular parameters that I used to generate the original proposal -- I have my own domain on which to impose my personal aesthetic preferences, and I don't need to take over matplotlib too :) (But I do think it's worth distinguishing the matplotlib default from the matlab default.) Michael |
|
From: Michael W. <mw...@st...> - 2015-02-18 17:03:16
|
Cool! I knew there had been some useful tools posted on the earlier thread but didn't have time to dig them out. Interesting observation about the colorfulness. I don't know enough about all the transformations involved to full account for that, but I added some stuff to the notebook to figure out how much of that might be caused by straying out of gamut. It looks like the map I created does a pretty good job and is only getting clamped at the very low end and near the high end, so I don't think it's a complete explanation for the undulating "colorfulness": http://nbviewer.ipython.org/gist/mwaskom/6a43a3b94eca4a9e2e8b By means of disclosure, I did this before having coffee, so it might be wrong... |
|
From: Eric F. <ef...@ha...> - 2015-02-18 16:48:10
|
On 2015/02/18 6:31 AM, Benjamin Root wrote: > The problem I have with hcl is that while it is technically "colorful" > (or whatever the term may be), only the reds really come out because the > other colors are only used when either really light or really dark. > Perhaps squashing the brightness range a bit and let the natural > lightness of yellow and the natural darkness of blue come through on > their own. (does that even make any sense to anybody else? it makes > sense in my head, but I am certainly am not an expert in color perception) > > Ben Root > > P.S. - Of course, my own color perception weirdness might be at play > here and the colormap looks perfectly fine to everybody else... My own reaction to it is that it seems like a nicely *functional* colormap, one I would want to have available and probably would sometimes use, but it is not particularly aesthetically *pleasing*. I think this is consistent with Olga's earlier post as well. Eric |
127 messages has been excluded from this view by a project administrator.
