Menu
▾
▴
Re: [Gnuplot-info] 12M? or 12 000 000? (not 12000000)
|
From: Emanuel B. <in...@da...> - 2022-06-24 05:05:51
|
Norwid Behrnd via gnuplot-info wrote:

> + gnuplot actually may add SI prefixes (k, M, etc.) on the
>   scales for you and show user-defined tics. For this to
>   happen, drop "set format y "%.0f" to try instead ``` set
>   format y '%.0s %c'
>
> set ytics font "verdana,10" add \
> ("25 M"   2.5e7)  # only shown for the ordinate scaling by lg
>
> set logscale y  # i.e., the implicit form of "set logscale y 10"

Oh, cool!

> Perhaps altogether with an instruction like "set
> yrange[1000:1e9]"

Done.

> this may justify to move/reorganize the keys a little bit.

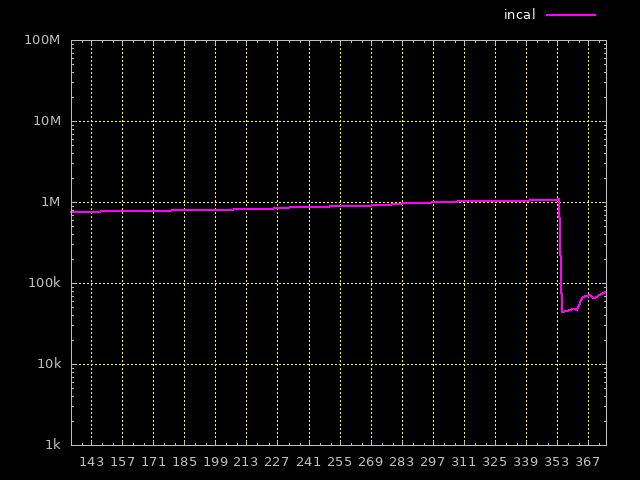
https://dataswamp.org/~incal/hits/hits.png B)

--
underground experts united
https://dataswamp.org/~incal
|