
Menu
▾
▴
[Gnuplot-info] Weird spherical mapping?
|
From: Simon L. <s_l...@cs...> - 2016-05-13 16:00:41
|
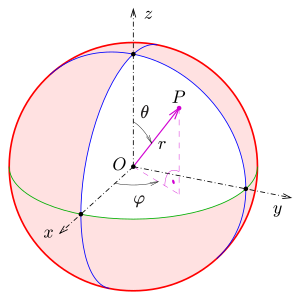
Hello, I'm trying to plot some 3D points defined in spherical coordinates. (like this https://upload.wikimedia.org/wikipedia/commons/thumb/6/69/Kugelkoord-def.svg/300px-Kugelkoord-def.svg.png) So as specified in the wikipedia article[1] the spherical->carthesian conversion should works like this: x = r * sin(theta) * cos(phi) y = r * sin(theta) * sin(phi) z = r * cos(theta) My problem is now, that as documented in (set mapping spherical) gnuplot does the spherical->carthesian conversion like this: x = r * cos(theta) * cos(phi) y = r * sin(theta) * cos(phi) z = r * sin(phi) For me this seems like an odd non-standard way of doing things. But on the other side, I'm not really familiar with the whole thing. How can I achieve an output with correct corrdinates for my data? thanks in advace, Simon --------- script: set xlabel "x" set ylabel "y" set zlabel "z" set xrange [-1:1] set yrange [-1:1] set zrange [-1:1] set mapping spherical set angles degrees splot 'test.dat' pause -1 data: #theta phi r 0 0 1 90 180 1 [1] https://en.wikipedia.org/wiki/Spherical_coordinate_system#Cartesian_coordinates |
)

