Menu
▾
▴
line type 0: wxt vs pngcairo
|
From: Allin C. <cot...@wf...> - 2014-11-15 22:41:07
|
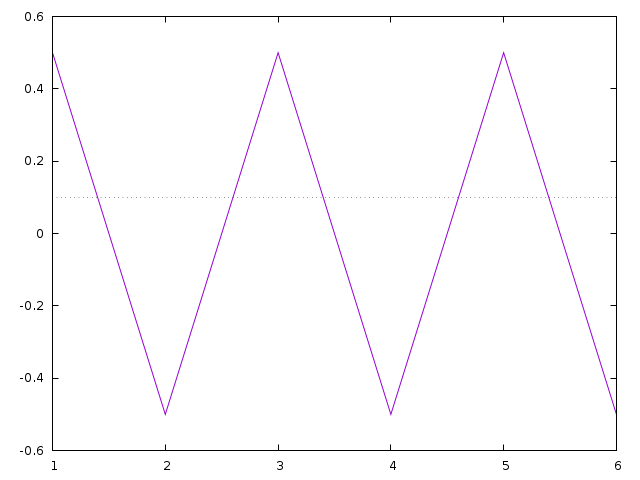
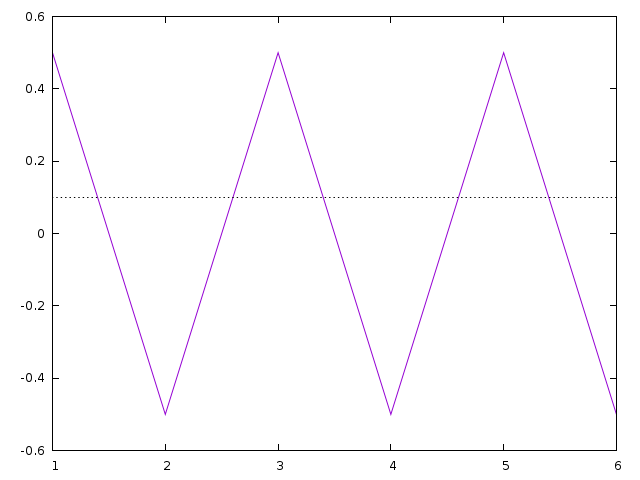
Here's an issue which (hopefully) ought to be somewhat simpler than the last one I mentioned -- although I've taken a look in the code and I'm having difficulty seeing where it's coming from. Here's a trivial test case (uncomment one or the other term/output): <gnuplot> set term pngcairo size 640,480 font "Sans,10" set output 'pngcairo.png' # set term wxt size 640,480 font "Sans,10" plot '-' notitle w l, 0.10 notitle w l lt 0 1 0.5 2 -0.5 3 0.5 4 -0.5 5 0.5 6 -0.5 </gnuplot> I'm comparing the pngcairo.png produced via the pngcairo terminal and a file named wxt.png which I produced via the "Save File" button in a gnuplot wxt window (and which is a faithful rendition of what is displayed on-screen via wxt). The PNG files are basically identical except for the horizontal line at y = 0.10 with "lt 0". With the wxt term this line is just as I would wish it to be; with the pngcairo term it is, IMO, too faint. The two files (produced via the script above with current CVS gnuplot master) are available as: http://users.wfu.edu/cottrell/gp5/pngcairo.png http://users.wfu.edu/cottrell/gp5/wxt.png -- Allin Cottrell Department of Economics Wake Forest University |