Menu
▾
▴
[Gnuplot-info] Data structure
|
From: Bo J. <li...@f7...> - 2013-11-17 21:07:51
|
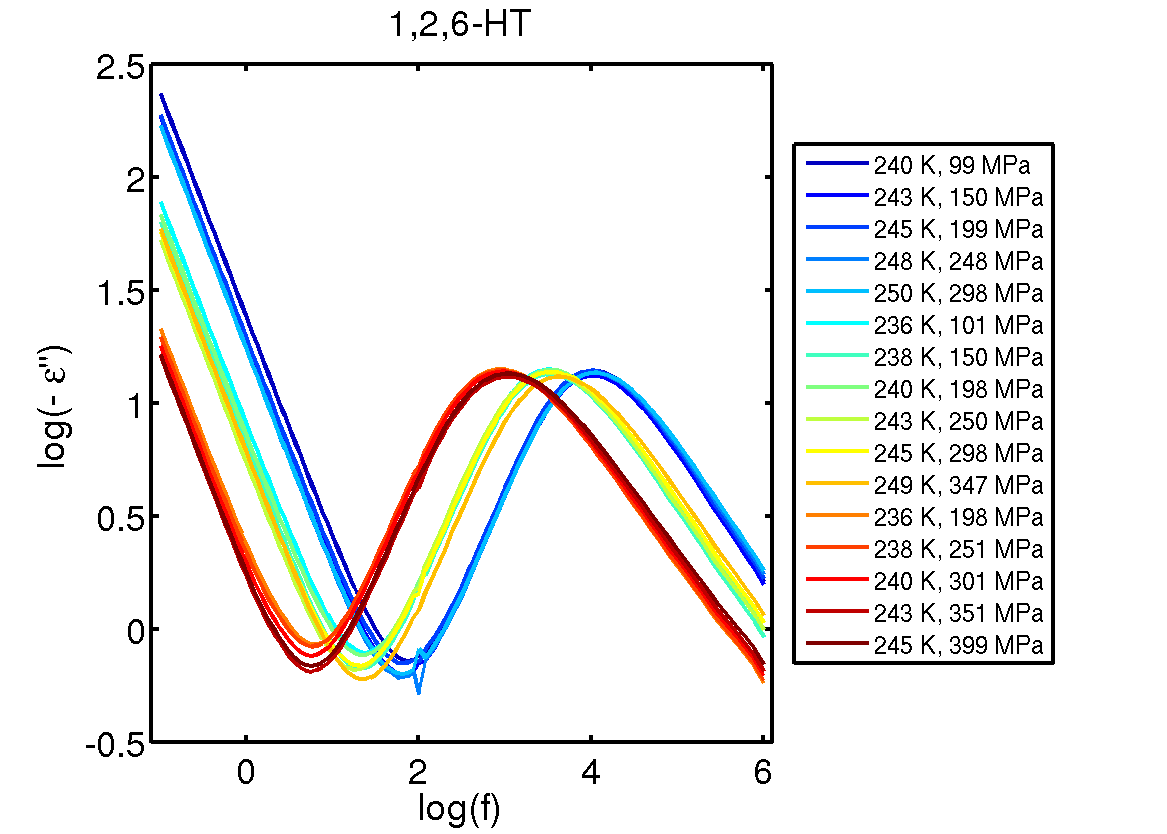
Hi all, I would like some advise to how to structure data in the best way. I need to make plots containing spectra as function of temperature (as the one shown on : http://glass.ruc.dk/data/data/J_Chem_Phys_139_101101_data/126HT/126HT.png ) I have all data in Matlab and normally makes specialized output files for the final print quality plotting in gnuplot. However, how do I structure this kind of data? I would like if the plotting script automatically loop over the spectra (the number of spectra could be written to a file if needed) and for each spectrum * The line style should change (in a controlled manner) * The title/legend should automatically be read and added. * On some plots labels should be added, which should also be read from a file. An alternative would be to make Matlab output the plot lines, and in this way performing the loop. Best Bo |