Menu
▾
▴
Re: differences between the gnuplot binary and its help
|
From: Shigeharu T. <sh...@ie...> - 2010-02-25 02:20:15
|
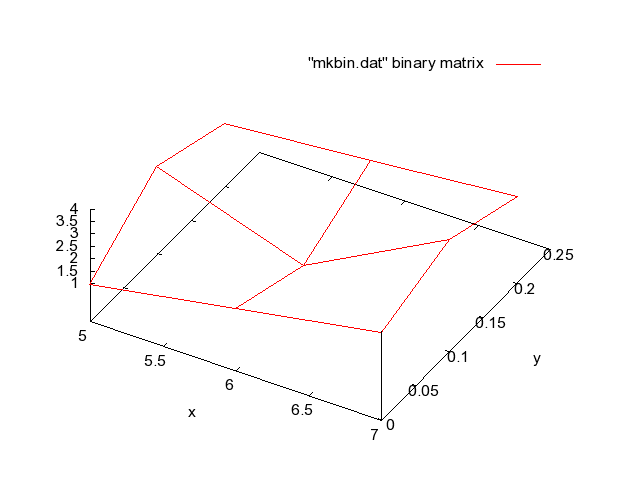
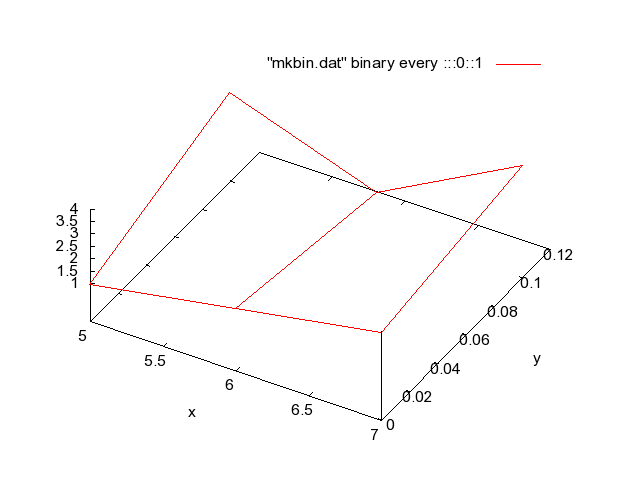
shige 02/25 2010 ---------------- I wrote: | I prepared sample scripts, data, and results. See | | http://takeno.iee.niit.ac.jp/~shige/unix/gnuplot/data/mkbin.c | http://takeno.iee.niit.ac.jp/~shige/unix/gnuplot/data/mkbin.gp | http://takeno.iee.niit.ac.jp/~shige/unix/gnuplot/data/mkbin1.gif | http://takeno.iee.niit.ac.jp/~shige/unix/gnuplot/data/mkbin2.gif I explane them. mkbin.c make the following binary matrix data: 3.0 5.0 6.0 7.0 (<N+1> <y0> <y1> <y2>) 0.0 1.0 2.0 3.0 ( <x0> <z0,0> <z0,1> <z0,2>) 0.1 3.0 1.0 4.0 ( <x1> <z1,0> <z1,1> <z1,2>) 0.2 2.0 2.5 3.0 ( <x2> <z2,0> <z2,1> <z2,2>) Gnuplot script mkbin.gp makes images mkbin1.gif and mkbin2.gif from the data made by mkbin.c. Gnuplot.doc says that gnuplot treat it as the following: 0.0 5.0 1.0 0.0 6.0 2.0 0.0 7.0 3.0 0.1 5.0 3.0 0.1 6.0 1.0 0.1 7.0 4.0 0.2 5.0 2.0 0.2 6.0 2.5 0.2 7.0 3.0 However, images mkbin1.gif and mkbin2.gif show that these are made from the data 5.0 0.0 1.0 6.0 0.0 2.0 7.0 0.0 3.0 5.0 0.1 3.0 6.0 0.1 1.0 7.0 0.1 4.0 5.0 0.2 2.0 6.0 0.2 2.5 7.0 0.2 3.0 Moreover, I found a problem in these tests. The following script ! ./mkbin > mkbin.dat splot "mkbin.dat" binary matrix with lines works. But, splot "< ./mkbin" binary matrix with lines does not work and gnuplot says "line 1: Data file is empty". OS: Solaris 9 (sparc) CC: gcc-3.4.3 gnuplot: gnuplot-4.5 (CVS version) +========================================================+ Shigeharu TAKENO NIigata Institute of Technology kashiwazaki,Niigata 945-1195 JAPAN sh...@ie... TEL(&FAX): +81-257-22-8161 +========================================================+ |