
Menu
▾
▴
gnuplot-info — For questions and discussion about gnuplot
You can subscribe to this list here.
| 2003 |
Jan
|
Feb
|
Mar
|
Apr
|
May
|
Jun
|
Jul
|
Aug
|
Sep
|
Oct
(2) |
Nov
(2) |
Dec
|
|---|---|---|---|---|---|---|---|---|---|---|---|---|
| 2004 |
Jan
(3) |
Feb
(1) |
Mar
(2) |
Apr
(22) |
May
(52) |
Jun
(43) |
Jul
(36) |
Aug
(59) |
Sep
(37) |
Oct
(55) |
Nov
(39) |
Dec
(36) |
| 2005 |
Jan
(64) |
Feb
(40) |
Mar
(62) |
Apr
(58) |
May
(256) |
Jun
(77) |
Jul
(80) |
Aug
(39) |
Sep
(56) |
Oct
(36) |
Nov
(113) |
Dec
(68) |
| 2006 |
Jan
(43) |
Feb
(64) |
Mar
(69) |
Apr
(60) |
May
(71) |
Jun
(53) |
Jul
(63) |
Aug
(63) |
Sep
(76) |
Oct
(85) |
Nov
(82) |
Dec
(73) |
| 2007 |
Jan
(75) |
Feb
(82) |
Mar
(84) |
Apr
(104) |
May
(67) |
Jun
(101) |
Jul
(107) |
Aug
(138) |
Sep
(128) |
Oct
(106) |
Nov
(112) |
Dec
(112) |
| 2008 |
Jan
(94) |
Feb
(87) |
Mar
(146) |
Apr
(169) |
May
(75) |
Jun
(26) |
Jul
(26) |
Aug
(7) |
Sep
(18) |
Oct
(53) |
Nov
(42) |
Dec
(19) |
| 2009 |
Jan
(43) |
Feb
(39) |
Mar
(18) |
Apr
(45) |
May
(66) |
Jun
(87) |
Jul
(56) |
Aug
(41) |
Sep
(56) |
Oct
(139) |
Nov
(98) |
Dec
(88) |
| 2010 |
Jan
(81) |
Feb
(79) |
Mar
(83) |
Apr
(97) |
May
(124) |
Jun
(84) |
Jul
(53) |
Aug
(85) |
Sep
(89) |
Oct
(50) |
Nov
(98) |
Dec
(78) |
| 2011 |
Jan
(97) |
Feb
(74) |
Mar
(68) |
Apr
(54) |
May
(63) |
Jun
(59) |
Jul
(65) |
Aug
(58) |
Sep
(37) |
Oct
(40) |
Nov
(59) |
Dec
(35) |
| 2012 |
Jan
(16) |
Feb
(56) |
Mar
(63) |
Apr
(25) |
May
(48) |
Jun
(58) |
Jul
(20) |
Aug
(13) |
Sep
(43) |
Oct
(35) |
Nov
(20) |
Dec
(17) |
| 2013 |
Jan
(22) |
Feb
(11) |
Mar
(51) |
Apr
(34) |
May
(57) |
Jun
(27) |
Jul
(70) |
Aug
(30) |
Sep
(38) |
Oct
(53) |
Nov
(40) |
Dec
(25) |
| 2014 |
Jan
(26) |
Feb
(35) |
Mar
(60) |
Apr
(12) |
May
(17) |
Jun
(15) |
Jul
(9) |
Aug
(18) |
Sep
(46) |
Oct
(18) |
Nov
(19) |
Dec
(15) |
| 2015 |
Jan
(17) |
Feb
(28) |
Mar
(21) |
Apr
(54) |
May
(36) |
Jun
(8) |
Jul
(30) |
Aug
(13) |
Sep
(3) |
Oct
(28) |
Nov
(3) |
Dec
(3) |
| 2016 |
Jan
(11) |
Feb
(9) |
Mar
(29) |
Apr
(10) |
May
(8) |
Jun
(5) |
Jul
(50) |
Aug
(57) |
Sep
(13) |
Oct
(5) |
Nov
(17) |
Dec
(11) |
| 2017 |
Jan
(3) |
Feb
(23) |
Mar
(16) |
Apr
(7) |
May
(15) |
Jun
(12) |
Jul
(48) |
Aug
(15) |
Sep
(3) |
Oct
(20) |
Nov
(28) |
Dec
(21) |
| 2018 |
Jan
(13) |
Feb
(21) |
Mar
(21) |
Apr
(7) |
May
(3) |
Jun
(7) |
Jul
(27) |
Aug
(38) |
Sep
(4) |
Oct
(30) |
Nov
(22) |
Dec
|
| 2019 |
Jan
(5) |
Feb
(16) |
Mar
(1) |
Apr
(9) |
May
(7) |
Jun
(20) |
Jul
(13) |
Aug
(3) |
Sep
(2) |
Oct
(2) |
Nov
(2) |
Dec
(4) |
| 2020 |
Jan
(6) |
Feb
(11) |
Mar
(1) |
Apr
(18) |
May
(4) |
Jun
(5) |
Jul
(12) |
Aug
(1) |
Sep
(3) |
Oct
(7) |
Nov
(1) |
Dec
(17) |
| 2021 |
Jan
(1) |
Feb
(11) |
Mar
(16) |
Apr
(6) |
May
(5) |
Jun
(1) |
Jul
(1) |
Aug
(2) |
Sep
(8) |
Oct
(10) |
Nov
(4) |
Dec
(4) |
| 2022 |
Jan
(9) |
Feb
(35) |
Mar
(4) |
Apr
|
May
(3) |
Jun
(49) |
Jul
(11) |
Aug
|
Sep
(5) |
Oct
(2) |
Nov
(16) |
Dec
(13) |
| 2023 |
Jan
|
Feb
(8) |
Mar
(3) |
Apr
|
May
(8) |
Jun
|
Jul
(5) |
Aug
|
Sep
|
Oct
(2) |
Nov
|
Dec
(2) |
| 2024 |
Jan
(6) |
Feb
(9) |
Mar
|
Apr
(26) |
May
(24) |
Jun
|
Jul
(4) |
Aug
(2) |
Sep
(1) |
Oct
(10) |
Nov
(9) |
Dec
|
| 2025 |
Jan
|
Feb
(22) |
Mar
|
Apr
(1) |
May
|
Jun
|
Jul
|
Aug
|
Sep
(1) |
Oct
(1) |
Nov
|
Dec
(4) |
| 2026 |
Jan
|
Feb
(24) |
Mar
(20) |
Apr
(18) |
May
(2) |
Jun
(2) |
Jul
(2) |
Aug
(3) |
Sep
|
Oct
|
Nov
|
Dec
|
|
From: Dieter J. <die...@t-...> - 2008-05-09 22:30:06
|
Hi Chris,
you could probably do a little awk magic and pipe the resulting data into
gnuplot. You would have to open both files in awk (in perl ...), add the two
values and pipe the result into gnuplot, where you'd plot them.
If your files are that large as you describe it might be impossible to hold
both the data sets in ram at once (more than 1 hour of writing into a file
from a C-program ought to be quite a bit of data ....)
Hope this helps,
take care


Dieter

--
-----------------------------------------------------------

                               |
                                \
                 /\_/\           |
                | ~x~ |/-----\   /
                 \   /-       \_/
  ^^__   _        /  _  ____   /
 <°°__ \- \_/     |  |/    |  |
  ||  ||         _| _|    _| _|

if you really want to see the pictures above - use some font
with constant spacing like courier! :-)
-----------------------------------------------------------Am Freitag, 9. Mai
2008 20:33:19 schrieb cmartin:
> Hi,
> I'm trying to find a way to add two data sets(contained in different files)
> together and plot the result.  Is there any easy way of doing this.  For
> example, is there any way of creating a function, say f(x), which contains
> your data set?  If that is possible, then I could just read my data files
> into two functions, f(x) and g(x),  and then plot f(x)+g(x)
>
> Thanks for any help
> Chris
|
|
From: cmartin <cre...@ho...> - 2008-05-09 18:49:42
|
Julien Derr wrote: > > I guess the easy way of doing it is to paste the two files in one, and > then plot normally....with $1+$2 > The problem with this method is that my files are quite large and I have a few thousand of them(I have a C program which does this analysis for me, but I need to double check the results for some of them), so to add another column to my output would nearly double my program's running time(which is already at more than an hour, and already dominated by read-write time) -- View this message in context: http://www.nabble.com/Adding-multiple-data-sets-together-tp17154106p17154388.html Sent from the Gnuplot - User mailing list archive at Nabble.com. |
|
From: cmartin <cre...@ho...> - 2008-05-09 18:33:13
|
Hi, I'm trying to find a way to add two data sets(contained in different files) together and plot the result. Is there any easy way of doing this. For example, is there any way of creating a function, say f(x), which contains your data set? If that is possible, then I could just read my data files into two functions, f(x) and g(x), and then plot f(x)+g(x) Thanks for any help Chris -- View this message in context: http://www.nabble.com/Adding-multiple-data-sets-together-tp17154106p17154106.html Sent from the Gnuplot - User mailing list archive at Nabble.com. |
|
From: Heath F. <sch...@ph...> - 2008-05-09 17:44:10
|
Online Apppootheke - Beste Qualitaet - 100% wirksam Spezialangebot: Viiiaaa -ra 10 tab x 100 mg + Ciiiaaa ..alis 10 tab x 20 mg - 53,82 EURO Viiiaaa -ra ist das popularste Medikament gegen sexuelle Funktionsstorung Viiiaaa -ra hilft gegen Impotenz und Errreee.ektionsstorungen beim Mann Viiiaaa -ra 10 tab - 26,20 Euro Viiiaaa -ra 30 tab - 51,97 Euro - Sie sparen: 27,00 Euro Viiiaaa -ra 60 tab - 95,69 Euro - Sie sparen: 62,00 Euro Viiiaaa -ra 90 tab - 136,9 Euro - Sie sparen: 100,00 Euro Ciiiaaa ..alis ist eine brandneue Behandlung fur Impooootenz, die wie Viiiaaa -ra wirkt, nur dass sie schnellere Ergebnisse liefert, eine hohere Erfolgsquote hat, halt bis zu 32 Stunden langer, und weniger unbequeme Nebeneffekte verursacht! Ciiiaaa ..alis 10 tab - 30,00 Euro Ciiiaaa ..alis 20 tab - 59,35 Euro - Sie sparen: 2,00 Euro Ciiiaaa ..alis 30 tab - 80,30 Euro - Sie sparen: 12,00 Euro Bestellen Sie das Potenzmittel Ciiiaaa ..alis rezeptfrei online. -: http://happenhim.com :- Bestellungen werden in diskreten Paketen, welche wie gewöhnliche Sendungen aussehen, versendet. Ihre Anonymität ist unser erstes Gebot: wir geben niemals einen Betreff oder eine Beschreibung der Sendung an. |
|
From: Calame <sk{<si...@Pl...> - 2008-05-09 13:49:07
|
Travel the world and see the softest, smoothest, and most delicate boobs with a mighty kangaroo pounder. http://www.oposdea.com/ |
|
From: Canizaro <Dra...@a1...> - 2008-05-09 11:03:19
|
A perfect lovemaking life is only weeks away with our revolutionary product http://www.nooiaeral.com/ |
|
From: MR. f. <sh...@on...> - 2008-05-08 23:41:14
|
你集邮吗? 如你喜欢,请点开网页:http://www.shlptd.com/ypl-sm.htm 或 http://www.shlptd.com/ , 这里有全国最便宜的品种,供你选购、欣赏。 |
|
From: Matias S. <mat...@gm...> - 2008-05-08 12:05:05
|
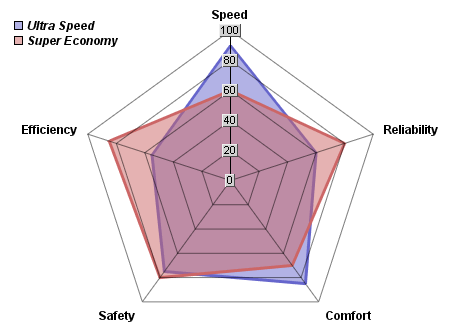
Is it possible to make a chart like this: http://www.advsofteng.com/images/multiradar_g.png with gnuplot? Where can I find some examples? Thanks a lot. |
|
From: Thomas S. <t.s...@fz...> - 2008-05-08 10:45:02
|
> or do you have an idea of another trick? what you could do: plot curve 1 solid, curve 2 solid, curve 1 dashed line an example: set xrange [-pi:pi] set yrange [-1.1:1.1] set term post col dash set style line 1 lt 1 lc 2 lw 5 set style line 2 lt 3 lc 2 lw 5 set style line 3 lt 1 lc 1 lw 5 set out 'plot.ps' plot sin(x) ls 1, 1.02*sin(x) ls 3, sin(x) not ls 2 set out http://www.nabble.com/file/p17124712/plot.gif -- View this message in context: http://www.nabble.com/plot-range-tp17079869p17124712.html Sent from the Gnuplot - User mailing list archive at Nabble.com. |

|
From: 李小姐 <zx_...@16...> - 2008-05-08 10:04:13
|
      TO:  尊敬的客户

  您好!感谢您对商旅的支持与信赖,热诚欢迎您的光临及享受我们殷勤的服务!

(如果您不需要每月收到我们的机票信息,请致电TEL:52953471*85  给您带来的不便,请见谅!)

                 国 内 机 票 特 价(不含机建及燃油费)
目的地     原价    优惠价      目的地     原价    优惠价     目的地      原价      优惠价

北京       1130      680       海口       1660      330      深圳        1400        700
大连       1060      640       广州       1280      640      沈阳        1300        390
厦门        960      480       乌鲁木齐   2800      840      桂林        1300        750
天津       1030      620       昆明       1900      760      重庆        1490        450
济南        760      480       哈尔滨     1760      530      成都        1610        810
西安       1260      640       南宁       1660      830      南昌         710        490
长春       1600     1120       福州        780      390      武汉         810        650
长沙        890      490       贵阳       1600      960      青岛         740        440
三亚       1890      570       汕头        990      590      珠海        1400        560
烟台        790      400       太原       1200      480      郑州         800        400

                国 内 往 返 特 价(不含机建及燃油费)
上海-武汉-上海     820             上海-昆明-上海      1680
上海-厦门-上海     960             上海-广州-上海      1280
上海-福州-上海     780             上海-深圳-上海      1400
上海-南昌-上海     720             上海-海口-上海      1000
上海-长沙-上海     900             上海-郑州-上海       800
上海-太原-上海    1200             上海-哈尔滨-上海    2100
上海-天津-上海    1040             上海-沈阳-上海      1560
上海-北京-上海    1800             上海-大连-上海      1280
上海-西安-上海    1260             上海-长春-上海      1900
上海-济南-上海     760             上海-汕头-上海      1000
上海-青岛-上海     660             上海-温州-上海       840
上海-烟台-上海     640             上海-南宁-上海      1000
上海-贵阳-上海    1400             上海-成都-上海      1620
上海-桂林-上海    1300             上海-重庆-上海      1340
上海-三亚-上海    1200             上海-乌鲁木齐-上海  2800
          (欲知更多线路,请致电咨询!)

                  国  际  机  票  特  价(不含税收)

目的地     单程     往返         目的地    单程   往返        目的地     单程    往返

香港        900    1980(FM)      釜山       1200   2180(FM)   澳门      1150    1980(MU)
羽田/东京  2350    3280(MU)      大阪       1790   1000(MU)   吉隆坡    2750    2440(MH)
悉尼       3650    4200(CA)      金浦       1220   2090(MU)   雅加达    1680    3200(GA)
迪拜       5380    7780(EK)      汉城       1180   1980(FM)   胡志明    1760    2500(CZ)
华盛顿     4250    5980(NH)      名古屋     1150   1300(CZ)   伦敦      2680    3980(MU)
新加坡     1880    1850(MU)      纽约       3050   4080(MU)   曼谷      1880    2280(MU)
洛杉矶     2850    4500(CA)      温哥华     2280   3680(MU)   巴黎      2990    4880(CA)
法兰克福   3360     4950(MU)      布里斯班   4080   5980(MU)   福冈      1550    1000(CA)
阿姆斯特丹 5860    5880(KL)      墨尔本     3780   4200(MU)   莫斯科    3080    4480(MU)
旧金山     2980    4980(CA)      罗马/米兰  3980   5880(CA)   芝加哥    4280    2960(AA)

上海----台北(香港转机)   单程:1580  往返:3200   上海--济州--高雄/台北    单程:1380 往返:2980

上海----台北(澳门转机)   单程:1480  往返:3280   上海---澳门/香港---上海  往返:1800(地点可互换)
                                                                (欲知更多行程,请致电咨询!)

订票可参加高额的积分奖励

 	积分累积到200分,可直接兑换现金RMB150。
 	积分累积到500分,可享受商旅旅行提供的四星级酒店免费入住一晚或者现金奖励350RMB。
 	积分累积到700分,可享受商旅旅行提供的五星级酒店免费入住一晚或者现金奖励500RMB。
 	积分累积到900分,可享受现金奖励800RMB或兑换价值900RMB单程机票一张。
 	积分累积到1100分,可享受现金奖励1100RMB或兑换价值1300元现金抵用。
 	凡收到传真或邮件的客户,首次预订机票时我们将免费赠送普通会员卡一张,并随卡赠送100元现金抵用券。

欲知更多优惠 请来电咨询! 您的满意是我们最大的追求!

本中心同时经营国内、国际众多航线机票及酒店预订、旅游;并提供国际货运/快件、汽车租赁。欢迎来电查询!

详情请登陆 www.51jipiaowang.com    邮件请发送:li_...@ho...

新增:您可在 我要机票网 上免费注册成为会员,也可在网上查询航班信息并直接提交预订单!

国内专线: 021-52951512  52954523     联系人:朱小姐   MSN:sha...@ho...
国际专线: 021-52951319  52951309     联系人: 李小姐    MSN:li_...@ho...
|
|
From: mircescu <sen...@03...> - 2008-05-08 08:32:35
|
Your love life is set to blossom http://www.poweieautik.com/ |
|
From: konopka <sel...@03...> - 2008-05-08 08:32:14
|
Ask your sister, and she will tell you 3 inch wieners are failures. http://www.poerlaen.com/ |
|
From: Thomas S. <t.s...@fz...> - 2008-05-08 07:31:23
|
> I have an esthetic problem... > I have basically two curves which are more or less > the same.. I want to plot them in a same graph with > a dashed line..of two different colors...one color for > each curve ... > > so the best would be to have dashed lines which > are a bit shifted (ideally in quadrature..) > is that possible??? shifting the dashed pattern along the graph? or defining two complementary dashed patterns? don't think that's easy to do... it depends on the 'terminal' you are using how dashed lines are implemented. in case of emulated dashed lines it may be possible, but for the majority of terminals with dashed lines capability it is left to the output device (which may be a printer, plotter, or a program) to produce dashed lines. even if there would be some trick it would apply to a specific terminal only. > can we set that? or do you have an idea > of another trick? for plotting two functions i would combine a solid and a dashed curve. use the 'test' command to see which dashed lines exist for the terminal you are using and choose the appropriate line types. -- View this message in context: http://www.nabble.com/plot-range-tp17079869p17121877.html Sent from the Gnuplot - User mailing list archive at Nabble.com. |
|
From: Alston c. <Wes...@af...> - 2008-05-07 23:28:08
|
Certified Doctors in the USA --> Doctor Mailing List ### 756,448 Doctors 543,997 Business Tel #'s 285,466 Office Fax Nos 17,970 e-mails Coverage for many different medical specialties you can sort by many different fields like zip or county Reduced to only: $390 area representative: jes...@ho... valid until May9 email with 272 in the subject to ensure no further communication from us |
|
From: Meredith F. <rad...@bb...> - 2008-05-07 17:24:32
|
Online Apppootheke - Beste Qualitaet - 100% wirksam Spezialangebot: Viiiaaa -ra 10 tab x 100 mg + Ciiiaaa ..alis 10 tab x 20 mg - 53,82 EURO Viiiaaa -ra ist das popularste Medikament gegen sexuelle Funktionsstorung Viiiaaa -ra hilft gegen Impotenz und Errreee.ektionsstorungen beim Mann Viiiaaa -ra 10 tab - 26,20 Euro Viiiaaa -ra 30 tab - 51,97 Euro - Sie sparen: 27,00 Euro Viiiaaa -ra 60 tab - 95,69 Euro - Sie sparen: 62,00 Euro Viiiaaa -ra 90 tab - 136,9 Euro - Sie sparen: 100,00 Euro Ciiiaaa ..alis ist eine brandneue Behandlung fur Impooootenz, die wie Viiiaaa -ra wirkt, nur dass sie schnellere Ergebnisse liefert, eine hohere Erfolgsquote hat, halt bis zu 32 Stunden langer, und weniger unbequeme Nebeneffekte verursacht! Ciiiaaa ..alis 10 tab - 30,00 Euro Ciiiaaa ..alis 20 tab - 59,35 Euro - Sie sparen: 2,00 Euro Ciiiaaa ..alis 30 tab - 80,30 Euro - Sie sparen: 12,00 Euro Bestellen Sie das Potenzmittel Ciiiaaa ..alis rezeptfrei online. -: http://yettable.com :- Bestellungen werden in diskreten Paketen, welche wie gewöhnliche Sendungen aussehen, versendet. Ihre Anonymität ist unser erstes Gebot: wir geben niemals einen Betreff oder eine Beschreibung der Sendung an. |
|
From: Николай В. <ss...@le...> - 2008-05-07 13:04:06
|
Добрый день, Дамы и Господа! В свяи с существенно возросшей актуальностью вопроса "Белой зарплаты" Обратите внимание на наше предложение: Действующие бизнес-схемы минимизирования зарплатных налогов в 2оо8 году. Уменьшение налогового бремени не выходя за рамки действующего законодательства РФ. Книга и СД диск = 40 схем и 6О форм ==> 100% Информации Уникальный информационно-аналитический материал объемом 480 страниц и СД. Подробнее и заявка на сайте 1О69 ру (цифрами и латиницей) Телефон для справок: 8-(495)-585-1О6-8 Всего наилучшего. Основа всех этих изменений поразительно проста: это поток цифровой информации. Мы уже лет тридцать живем в информационную эру, но покупатели все еще ищут продавцов по старинке, поскольку основная часть обмена информацией между компаниями по-прежнему происходит с помощью бумажных носителей. Да, многие используют возможности информационных технологий - но лишь для контроля за основными операциями: управлением производственными системами, составлением счетов, ведением бухгалтерского учета и расчета налогов. Все это - не более чем автоматизация старых процессов. |
|
From: Ariston <Ari...@Ra...> - 2008-05-07 11:51:48
|
Looking for a change in your life, look no further http://www.stylaist.com/ |
|
From: Beckman <ste...@Ra...> - 2008-05-07 11:50:53
|
Show her what you are made of with our brand new product http://www.kyzeran.com/ |
|
From: hlitz <hei...@gm...> - 2008-05-07 07:53:05
|
Hi, I want to plot a 3d plot using pm3d with interpolation. I am running gnuplot 4.2. I have scattered input data but used dgrid3d to define all points. set pm3d splot "input.dat" using 1:2:3 works showing a colored plot. However set pm3d interpolate 1,1 splot "input.dat" using 1:2:3 just plots points with no pm3d at all. Maybe the parameters to interpolate are wrong what does steps in scan stand for? My x and y axis ranges from 0 to 9 my z data from 0.85 to 0.92. thanks for your help! -- View this message in context: http://www.nabble.com/pm3d-interpolate-fails-tp17099369p17099369.html Sent from the Gnuplot - User mailing list archive at Nabble.com. |
|
From: Dieter J. <die...@t-...> - 2008-05-06 22:30:07
|
Dear Ranjita,
help plot ought to be your friend and tell you all you need to know.
plot x*x w p and so on and so forth ...
Take care


Dieter

--
-----------------------------------------------------------

                               |
                                \
                 /\_/\           |
                | ~x~ |/-----\   /
                 \   /-       \_/
  ^^__   _        /  _  ____   /
 <°°__ \- \_/     |  |/    |  |
  ||  ||         _| _|    _| _|

if you really want to see the pictures above - use some font
with constant spacing like courier! :-)
-----------------------------------------------------------Am Dienstag, 6. Mai
2008 07:38:46 schrieb Dr.Ranjita Mandal:
> Dear Sir
>
> Could you kindly tell me how to plot points only(no connecting lines) and
*****
|
|
From: orangensaft <mw...@gm...> - 2008-05-06 21:52:10
|
As far as i know, dashed line with color is difficult. It may be possible with postscript. But i have never tried it. Thomas could have better suggestion. micmac wrote: > > Dear all, > > I have an esthetic problem... > I have basically two curves which are more or less the same.. I want > to plot them in a same graph with a dashed line..of two different > colors...one color for each curve ... > > so the best would be to have dashed lines which are a bit shifted > (ideally in quadrature..) > is that possible??? > can we set that? or do you have an idea of another trick? > > thanks a lot, > Julien > > > > ------------------------------------------------------------------------- > This SF.net email is sponsored by the 2008 JavaOne(SM) Conference > Don't miss this year's exciting event. There's still time to save $100. > Use priority code J8TL2D2. > http://ad.doubleclick.net/clk;198757673;13503038;p?http://java.sun.com/javaone > _______________________________________________ > Gnuplot-info mailing list > Gnu...@li... > https://lists.sourceforge.net/lists/listinfo/gnuplot-info > > -- View this message in context: http://www.nabble.com/plot-range-tp17079869p17093159.html Sent from the Gnuplot - User mailing list archive at Nabble.com. |
|
From: Валентин М. <mul...@be...> - 2008-05-06 20:19:56
|
Новые бизнес-схемы минимизации зарплатных налогов 2008 года. Здесь |
|
From: Вадим Ю. <mor...@mt...> - 2008-05-06 17:21:47
|
Доброго времени суток, Господа Предприниматели! Предлагаем Вашему вниманию: Актуальные схемы минимизации налогов 2008 года. Минимизация налогов в рамках действующего законодательства Российскй Федерации. Эксклюзивный информационно-аналитический продукт на 480 страницах и CD. Книга и СД диск => 4о схем и 60 форм = 1ОО% Информации Форма для оформления заказа на сайте 1О69 su (цифры и латиница) Заявки принимаем на сайте, звоните: [495] 585-l-О68 Всего наилучшего. |
|
From: Julien D. <Jul...@da...> - 2008-05-06 16:42:57
|
Dear all, I have an esthetic problem... I have basically two curves which are more or less the same.. I want to plot them in a same graph with a dashed line..of two different colors...one color for each curve ... so the best would be to have dashed lines which are a bit shifted (ideally in quadrature..) is that possible??? can we set that? or do you have an idea of another trick? thanks a lot, Julien |
|
From: orangensaft <mw...@gm...> - 2008-05-06 14:20:30
|
thanks, thomas, it is solved. -- View this message in context: http://www.nabble.com/plot-range-tp17079869p17083578.html Sent from the Gnuplot - User mailing list archive at Nabble.com. |
635 messages has been excluded from this view by a project administrator.
