
Menu
▾
▴
gnuplot-info — For questions and discussion about gnuplot
You can subscribe to this list here.
| 2003 |
Jan
|
Feb
|
Mar
|
Apr
|
May
|
Jun
|
Jul
|
Aug
|
Sep
|
Oct
(2) |
Nov
(2) |
Dec
|
|---|---|---|---|---|---|---|---|---|---|---|---|---|
| 2004 |
Jan
(3) |
Feb
(1) |
Mar
(2) |
Apr
(22) |
May
(52) |
Jun
(43) |
Jul
(36) |
Aug
(59) |
Sep
(37) |
Oct
(55) |
Nov
(39) |
Dec
(36) |
| 2005 |
Jan
(64) |
Feb
(40) |
Mar
(62) |
Apr
(58) |
May
(256) |
Jun
(77) |
Jul
(80) |
Aug
(39) |
Sep
(56) |
Oct
(36) |
Nov
(113) |
Dec
(68) |
| 2006 |
Jan
(43) |
Feb
(64) |
Mar
(69) |
Apr
(60) |
May
(71) |
Jun
(53) |
Jul
(63) |
Aug
(63) |
Sep
(76) |
Oct
(85) |
Nov
(82) |
Dec
(73) |
| 2007 |
Jan
(75) |
Feb
(82) |
Mar
(84) |
Apr
(104) |
May
(67) |
Jun
(101) |
Jul
(107) |
Aug
(138) |
Sep
(128) |
Oct
(106) |
Nov
(112) |
Dec
(112) |
| 2008 |
Jan
(94) |
Feb
(87) |
Mar
(146) |
Apr
(169) |
May
(75) |
Jun
(26) |
Jul
(26) |
Aug
(7) |
Sep
(18) |
Oct
(53) |
Nov
(42) |
Dec
(19) |
| 2009 |
Jan
(43) |
Feb
(39) |
Mar
(18) |
Apr
(45) |
May
(66) |
Jun
(87) |
Jul
(56) |
Aug
(41) |
Sep
(56) |
Oct
(139) |
Nov
(98) |
Dec
(88) |
| 2010 |
Jan
(81) |
Feb
(79) |
Mar
(83) |
Apr
(97) |
May
(124) |
Jun
(84) |
Jul
(53) |
Aug
(85) |
Sep
(89) |
Oct
(50) |
Nov
(98) |
Dec
(78) |
| 2011 |
Jan
(97) |
Feb
(74) |
Mar
(68) |
Apr
(54) |
May
(63) |
Jun
(59) |
Jul
(65) |
Aug
(58) |
Sep
(37) |
Oct
(40) |
Nov
(59) |
Dec
(35) |
| 2012 |
Jan
(16) |
Feb
(56) |
Mar
(63) |
Apr
(25) |
May
(48) |
Jun
(58) |
Jul
(20) |
Aug
(13) |
Sep
(43) |
Oct
(35) |
Nov
(20) |
Dec
(17) |
| 2013 |
Jan
(22) |
Feb
(11) |
Mar
(51) |
Apr
(34) |
May
(57) |
Jun
(27) |
Jul
(70) |
Aug
(30) |
Sep
(38) |
Oct
(53) |
Nov
(40) |
Dec
(25) |
| 2014 |
Jan
(26) |
Feb
(35) |
Mar
(60) |
Apr
(12) |
May
(17) |
Jun
(15) |
Jul
(9) |
Aug
(18) |
Sep
(46) |
Oct
(18) |
Nov
(19) |
Dec
(15) |
| 2015 |
Jan
(17) |
Feb
(28) |
Mar
(21) |
Apr
(54) |
May
(36) |
Jun
(8) |
Jul
(30) |
Aug
(13) |
Sep
(3) |
Oct
(28) |
Nov
(3) |
Dec
(3) |
| 2016 |
Jan
(11) |
Feb
(9) |
Mar
(29) |
Apr
(10) |
May
(8) |
Jun
(5) |
Jul
(50) |
Aug
(57) |
Sep
(13) |
Oct
(5) |
Nov
(17) |
Dec
(11) |
| 2017 |
Jan
(3) |
Feb
(23) |
Mar
(16) |
Apr
(7) |
May
(15) |
Jun
(12) |
Jul
(48) |
Aug
(15) |
Sep
(3) |
Oct
(20) |
Nov
(28) |
Dec
(21) |
| 2018 |
Jan
(13) |
Feb
(21) |
Mar
(21) |
Apr
(7) |
May
(3) |
Jun
(7) |
Jul
(27) |
Aug
(38) |
Sep
(4) |
Oct
(30) |
Nov
(22) |
Dec
|
| 2019 |
Jan
(5) |
Feb
(16) |
Mar
(1) |
Apr
(9) |
May
(7) |
Jun
(20) |
Jul
(13) |
Aug
(3) |
Sep
(2) |
Oct
(2) |
Nov
(2) |
Dec
(4) |
| 2020 |
Jan
(6) |
Feb
(11) |
Mar
(1) |
Apr
(18) |
May
(4) |
Jun
(5) |
Jul
(12) |
Aug
(1) |
Sep
(3) |
Oct
(7) |
Nov
(1) |
Dec
(17) |
| 2021 |
Jan
(1) |
Feb
(11) |
Mar
(16) |
Apr
(6) |
May
(5) |
Jun
(1) |
Jul
(1) |
Aug
(2) |
Sep
(8) |
Oct
(10) |
Nov
(4) |
Dec
(4) |
| 2022 |
Jan
(9) |
Feb
(35) |
Mar
(4) |
Apr
|
May
(3) |
Jun
(49) |
Jul
(11) |
Aug
|
Sep
(5) |
Oct
(2) |
Nov
(16) |
Dec
(13) |
| 2023 |
Jan
|
Feb
(8) |
Mar
(3) |
Apr
|
May
(8) |
Jun
|
Jul
(5) |
Aug
|
Sep
|
Oct
(2) |
Nov
|
Dec
(2) |
| 2024 |
Jan
(6) |
Feb
(9) |
Mar
|
Apr
(26) |
May
(24) |
Jun
|
Jul
(4) |
Aug
(2) |
Sep
(1) |
Oct
(10) |
Nov
(9) |
Dec
|
| 2025 |
Jan
|
Feb
(22) |
Mar
|
Apr
(1) |
May
|
Jun
|
Jul
|
Aug
|
Sep
(1) |
Oct
(1) |
Nov
|
Dec
(4) |
| 2026 |
Jan
|
Feb
(24) |
Mar
(20) |
Apr
(18) |
May
(2) |
Jun
(2) |
Jul
(2) |
Aug
(3) |
Sep
|
Oct
|
Nov
|
Dec
|
|
From: Philipp K. J. <ja...@ie...> - 2026-02-26 19:45:30
|
On Thu, 26 Feb 2026 14:22:58 -0500 Alan <ala...@gm...> wrote: Have you checked out the built-in "pwd" command? > I believe (?) your suggestion is equivalent to using `system`, > so it is not a cross-platform solution. E.g., on Windows: > > gnuplot> print "`echo $HOME`" > $HOME > > (Note that $HOME is valid in PowerShell, but sadly > cmd remains the Windows default shell, and changing > that remains fraught.) > > > > On Thu, Feb 26, 2026 at 1:46 PM Michael Schuh < > Mic...@bo...> wrote: > > > How about this? > > > > michael@argon:~/tmp$ cat p.gnu > > home = "dogrun" > > print home > > home = "`echo $HOME`" > > print home > > > > > > michael@argon:~/tmp$ gnuplot p.gnu > > dogrun > > /home/michael > > > > On Thu, Feb 26, 2026 at 10:06 AM Alan <ala...@gm...> wrote: > > > >> Thanks for helping to look for a workaround, but I do not think so. > >> > >> Too many different computers and people involved. > >> > >> Let me ask this differently. > >> According to the manual (p.64), "The program then looks in the > >> user’s HOME directory". > >> So after launching, Gnuplot has already determined the location of > >> the home > >> directory. > >> Is there any way to ask Gnuplot for its value (as a string)? > >> If not, is there any reason for developers to avoid adding such a > >> feature? > >> > >> Thanks, Alan > >> > >> On Thu, Feb 26, 2026 at 10:51 AM Peter Rockett > >> <p.r...@sh... > >> > > >> wrote: > >> > >> > OK. Is the GNUPLOT_LIB environment variable what you need? Or the > >> > .gnuplot & GNUPLOT.INI startup files? > >> > > >> > P. > >> > > >> > On 26/02/2026 14:12, Alan wrote: > >> > > I would like to have data stored both > >> > > relative to the script file and more importantly relative to > >> > > the home directory, > >> > > and I would like an easy way to find the data on multiple > >> > > systems where the same relative relationships hold. > >> > > > >> > > Most important is being able to find the home directory > >> > > in the gnuplot script in a system independent way. > >> > > For example, I'd like my home and work computers > >> > > to have an output folder that is fixed relative to the home > >> > > directory, and I'd like Gnuplot to be able to find it without > >> > > relying on > >> `system`, > >> > > which requires a different commands depending on the shell. > >> > > (Powershell or cmd on Windows, vs zsh on Mac, vs bash or dash > >> > > on > >> Linux, > >> > > etc.) > >> > > > >> > > Also desirable is for the script to be able to find data > >> > > relative to the script's location, no matter what the > >> > > current working directory from which Gnuplot is launched. > >> > > As a simple example, suppose I am in folder `a` and do > >> > > gnuplot ./gnuplot/myscript.gpi > >> > > Then the pwd for Gnuplot becomes `a`, not the script directory. > >> > > In the script, I'd like to ask Gnuplot for the script > >> > > directory. > >> > > > >> > > Hope that's clearer, Alan > >> > > > >> > > On Thu, Feb 26, 2026 at 7:34 AM Peter Rockett via gnuplot-info > >> > > < gnu...@li...> wrote: > >> > > > >> > >> Not totally clear of the objective here, but FWIW, you can > >> > >> specify a path using "./abc/efg/hij" (i.e. using a forward > >> > >> slash) on both > >> Windows > >> > >> /and/ Unix/Linux, whereas Unix does not understand the '\' > >> > >> character > >> in > >> > >> this context. So the forward slash is system independent. > >> > >> > >> > >> P. > >> > >> > >> > >> On 25/02/2026 18:10, Alan wrote: > >> > >>> Does Gnuplot offer a system independent way to > >> > >>> create directory names relative to the home folder > >> > >>> (especially) and also relative to the script folder? > >> > >>> > >> > >>> I am aware of `system`, but that depends on the OS shell. > >> > >>> I'm not a C programmer, but I believe the tricks to retrieve > >> > >>> this information in a system independent way are pretty > >> > >>> standard. (?) > >> > >>> > >> > >>> Thank you. > >> > >>> > >> > >>> _______________________________________________ > >> > >>> gnuplot-info mailing list > >> > >>> gnu...@li... > >> > >>> Membership management via: > >> > >> https://lists.sourceforge.net/lists/listinfo/gnuplot-info > >> > >> _______________________________________________ > >> > >> gnuplot-info mailing list > >> > >> gnu...@li... > >> > >> Membership management via: > >> > >> https://lists.sourceforge.net/lists/listinfo/gnuplot-info > >> > >> > >> > > _______________________________________________ > >> > > gnuplot-info mailing list > >> > > gnu...@li... > >> > > Membership management via: > >> > https://lists.sourceforge.net/lists/listinfo/gnuplot-info > >> > > >> > >> _______________________________________________ > >> gnuplot-info mailing list > >> gnu...@li... > >> Membership management via: > >> https://lists.sourceforge.net/lists/listinfo/gnuplot-info > >> > > > > _______________________________________________ > gnuplot-info mailing list > gnu...@li... > Membership management via: > https://lists.sourceforge.net/lists/listinfo/gnuplot-info |
|
From: Ethan M. <eam...@gm...> - 2026-02-26 19:36:28
|
Gnuplot uses the linux/unix convention that ~ (tilde) represents the user's
home directory.
This is taken from the environmental variable HOME on linux and USERPROFILE
on windows.
So
     gnuplot>   load "~/myscript.gp"
loads myscript.gp from the user's home directory.
     gnuplot>   set print "~/sub/output.txt"
     gnuplot>   print "# New script"
     gnuplot>   print "# that doesn't do anything"
     gnuplot>   unset output
will create and write to a new file in a subdirectory of the user's HOME
directory.

    Ethan


On Thu, Feb 26, 2026 at 10:06 AM Alan <ala...@gm...> wrote:

> Thanks for helping to look for a workaround, but I do not think so.
>
> Too many different computers and people involved.
>
> Let me ask this differently.
> According to the manual (p.64), "The program then looks in the user’s HOME
> directory".
> So after launching, Gnuplot has already determined the location of the home
> directory.
> Is there any way to ask Gnuplot for its value (as a string)?
> If not, is there any reason for developers to avoid adding such a feature?
>
> Thanks, Alan
>
> On Thu, Feb 26, 2026 at 10:51 AM Peter Rockett <p.r...@sh...>
> wrote:
>
> > OK. Is the GNUPLOT_LIB environment variable what you need? Or the
> > .gnuplot & GNUPLOT.INI startup files?
> >
> > P.
> >
> > On 26/02/2026 14:12, Alan wrote:
> > > I would like to have data stored both
> > > relative to the script file and more importantly relative to the home
> > > directory,
> > > and I would like an easy way to find the data on multiple systems
> > > where the same relative relationships hold.
> > >
> > > Most important is being able to find the home directory
> > > in the gnuplot script in a system independent way.
> > > For example, I'd like my home and work computers
> > > to have an output folder that is fixed relative to the home directory,
> > > and I'd like Gnuplot to be able to find it without relying on `system`,
> > > which requires a different commands depending on the shell.
> > > (Powershell or cmd on Windows, vs zsh on Mac, vs bash or dash on Linux,
> > > etc.)
> > >
> > > Also desirable is for the script to be able to find data
> > > relative to the script's location, no matter what the
> > > current working directory from which Gnuplot is launched.
> > > As a simple example, suppose I am in folder `a` and do
> > > gnuplot ./gnuplot/myscript.gpi
> > > Then the pwd for Gnuplot becomes `a`, not the script directory.
> > > In the script, I'd like to ask Gnuplot for the script directory.
> > >
> > > Hope that's clearer, Alan
> > >
> > > On Thu, Feb 26, 2026 at 7:34 AM Peter Rockett via gnuplot-info <
> > > gnu...@li...> wrote:
> > >
> > >> Not totally clear of the objective here, but FWIW, you can specify a
> > >> path using "./abc/efg/hij" (i.e. using a forward slash) on both
> Windows
> > >> /and/ Unix/Linux, whereas Unix does not understand the '\' character
> in
> > >> this context. So the forward slash is system independent.
> > >>
> > >> P.
> > >>
> > >> On 25/02/2026 18:10, Alan wrote:
> > >>> Does Gnuplot offer a system independent way to
> > >>> create directory names relative to the home folder (especially)
> > >>> and also relative to the script folder?
> > >>>
> > >>> I am aware of `system`, but that depends on the OS shell.
> > >>> I'm not a C programmer, but I believe the tricks to retrieve this
> > >>> information in a system independent way are pretty standard. (?)
> > >>>
> > >>> Thank you.
> > >>>
> > >>> _______________________________________________
> > >>> gnuplot-info mailing list
> > >>> gnu...@li...
> > >>> Membership management via:
> > >> https://lists.sourceforge.net/lists/listinfo/gnuplot-info
> > >> _______________________________________________
> > >> gnuplot-info mailing list
> > >> gnu...@li...
> > >> Membership management via:
> > >> https://lists.sourceforge.net/lists/listinfo/gnuplot-info
> > >>
> > > _______________________________________________
> > > gnuplot-info mailing list
> > > gnu...@li...
> > > Membership management via:
> > https://lists.sourceforge.net/lists/listinfo/gnuplot-info
> >
>
> _______________________________________________
> gnuplot-info mailing list
> gnu...@li...
> Membership management via:
> https://lists.sourceforge.net/lists/listinfo/gnuplot-info
>
|
|
From: Michael S. <Mic...@bo...> - 2026-02-26 19:28:25
|
Correct, I wrote and tested my suggestion on a Debian system. I didn't test it on a Windows system. Unfortunately, it sounds like my suggestion will not work as written on a Windows system. Michael On Thu, Feb 26, 2026 at 11:23 AM Alan <ala...@gm...> wrote: > I believe (?) your suggestion is equivalent to using `system`, > so it is not a cross-platform solution. E.g., on Windows: > > gnuplot> print "`echo $HOME`" > $HOME > > (Note that $HOME is valid in PowerShell, but sadly > cmd remains the Windows default shell, and changing > that remains fraught.) > > > > On Thu, Feb 26, 2026 at 1:46 PM Michael Schuh < > Mic...@bo...> wrote: > > > How about this? > > > > michael@argon:~/tmp$ cat p.gnu > > home = "dogrun" > > print home > > home = "`echo $HOME`" > > print home > > > > > > michael@argon:~/tmp$ gnuplot p.gnu > > dogrun > > /home/michael > > > > On Thu, Feb 26, 2026 at 10:06 AM Alan <ala...@gm...> wrote: > > > >> Thanks for helping to look for a workaround, but I do not think so. > >> > >> Too many different computers and people involved. > >> > >> Let me ask this differently. > >> According to the manual (p.64), "The program then looks in the user’s > HOME > >> directory". > >> So after launching, Gnuplot has already determined the location of the > >> home > >> directory. > >> Is there any way to ask Gnuplot for its value (as a string)? > >> If not, is there any reason for developers to avoid adding such a > feature? > >> > >> Thanks, Alan > >> > >> On Thu, Feb 26, 2026 at 10:51 AM Peter Rockett < > p.r...@sh... > >> > > >> wrote: > >> > >> > OK. Is the GNUPLOT_LIB environment variable what you need? Or the > >> > .gnuplot & GNUPLOT.INI startup files? > >> > > >> > P. > >> > > >> > On 26/02/2026 14:12, Alan wrote: > >> > > I would like to have data stored both > >> > > relative to the script file and more importantly relative to the > home > >> > > directory, > >> > > and I would like an easy way to find the data on multiple systems > >> > > where the same relative relationships hold. > >> > > > >> > > Most important is being able to find the home directory > >> > > in the gnuplot script in a system independent way. > >> > > For example, I'd like my home and work computers > >> > > to have an output folder that is fixed relative to the home > directory, > >> > > and I'd like Gnuplot to be able to find it without relying on > >> `system`, > >> > > which requires a different commands depending on the shell. > >> > > (Powershell or cmd on Windows, vs zsh on Mac, vs bash or dash on > >> Linux, > >> > > etc.) > >> > > > >> > > Also desirable is for the script to be able to find data > >> > > relative to the script's location, no matter what the > >> > > current working directory from which Gnuplot is launched. > >> > > As a simple example, suppose I am in folder `a` and do > >> > > gnuplot ./gnuplot/myscript.gpi > >> > > Then the pwd for Gnuplot becomes `a`, not the script directory. > >> > > In the script, I'd like to ask Gnuplot for the script directory. > >> > > > >> > > Hope that's clearer, Alan > >> > > > >> > > On Thu, Feb 26, 2026 at 7:34 AM Peter Rockett via gnuplot-info < > >> > > gnu...@li...> wrote: > >> > > > >> > >> Not totally clear of the objective here, but FWIW, you can specify > a > >> > >> path using "./abc/efg/hij" (i.e. using a forward slash) on both > >> Windows > >> > >> /and/ Unix/Linux, whereas Unix does not understand the '\' > character > >> in > >> > >> this context. So the forward slash is system independent. > >> > >> > >> > >> P. > >> > >> > >> > >> On 25/02/2026 18:10, Alan wrote: > >> > >>> Does Gnuplot offer a system independent way to > >> > >>> create directory names relative to the home folder (especially) > >> > >>> and also relative to the script folder? > >> > >>> > >> > >>> I am aware of `system`, but that depends on the OS shell. > >> > >>> I'm not a C programmer, but I believe the tricks to retrieve this > >> > >>> information in a system independent way are pretty standard. (?) > >> > >>> > >> > >>> Thank you. > >> > >>> > >> > >>> _______________________________________________ > >> > >>> gnuplot-info mailing list > >> > >>> gnu...@li... > >> > >>> Membership management via: > >> > >> https://lists.sourceforge.net/lists/listinfo/gnuplot-info > >> > >> _______________________________________________ > >> > >> gnuplot-info mailing list > >> > >> gnu...@li... > >> > >> Membership management via: > >> > >> https://lists.sourceforge.net/lists/listinfo/gnuplot-info > >> > >> > >> > > _______________________________________________ > >> > > gnuplot-info mailing list > >> > > gnu...@li... > >> > > Membership management via: > >> > https://lists.sourceforge.net/lists/listinfo/gnuplot-info > >> > > >> > >> _______________________________________________ > >> gnuplot-info mailing list > >> gnu...@li... > >> Membership management via: > >> https://lists.sourceforge.net/lists/listinfo/gnuplot-info > >> > > > > _______________________________________________ > gnuplot-info mailing list > gnu...@li... > Membership management via: > https://lists.sourceforge.net/lists/listinfo/gnuplot-info > |
|
From: Alan <ala...@gm...> - 2026-02-26 19:23:36
|
I believe (?) your suggestion is equivalent to using `system`, so it is not a cross-platform solution. E.g., on Windows: gnuplot> print "`echo $HOME`" $HOME (Note that $HOME is valid in PowerShell, but sadly cmd remains the Windows default shell, and changing that remains fraught.) On Thu, Feb 26, 2026 at 1:46 PM Michael Schuh < Mic...@bo...> wrote: > How about this? > > michael@argon:~/tmp$ cat p.gnu > home = "dogrun" > print home > home = "`echo $HOME`" > print home > > > michael@argon:~/tmp$ gnuplot p.gnu > dogrun > /home/michael > > On Thu, Feb 26, 2026 at 10:06 AM Alan <ala...@gm...> wrote: > >> Thanks for helping to look for a workaround, but I do not think so. >> >> Too many different computers and people involved. >> >> Let me ask this differently. >> According to the manual (p.64), "The program then looks in the user’s HOME >> directory". >> So after launching, Gnuplot has already determined the location of the >> home >> directory. >> Is there any way to ask Gnuplot for its value (as a string)? >> If not, is there any reason for developers to avoid adding such a feature? >> >> Thanks, Alan >> >> On Thu, Feb 26, 2026 at 10:51 AM Peter Rockett <p.r...@sh... >> > >> wrote: >> >> > OK. Is the GNUPLOT_LIB environment variable what you need? Or the >> > .gnuplot & GNUPLOT.INI startup files? >> > >> > P. >> > >> > On 26/02/2026 14:12, Alan wrote: >> > > I would like to have data stored both >> > > relative to the script file and more importantly relative to the home >> > > directory, >> > > and I would like an easy way to find the data on multiple systems >> > > where the same relative relationships hold. >> > > >> > > Most important is being able to find the home directory >> > > in the gnuplot script in a system independent way. >> > > For example, I'd like my home and work computers >> > > to have an output folder that is fixed relative to the home directory, >> > > and I'd like Gnuplot to be able to find it without relying on >> `system`, >> > > which requires a different commands depending on the shell. >> > > (Powershell or cmd on Windows, vs zsh on Mac, vs bash or dash on >> Linux, >> > > etc.) >> > > >> > > Also desirable is for the script to be able to find data >> > > relative to the script's location, no matter what the >> > > current working directory from which Gnuplot is launched. >> > > As a simple example, suppose I am in folder `a` and do >> > > gnuplot ./gnuplot/myscript.gpi >> > > Then the pwd for Gnuplot becomes `a`, not the script directory. >> > > In the script, I'd like to ask Gnuplot for the script directory. >> > > >> > > Hope that's clearer, Alan >> > > >> > > On Thu, Feb 26, 2026 at 7:34 AM Peter Rockett via gnuplot-info < >> > > gnu...@li...> wrote: >> > > >> > >> Not totally clear of the objective here, but FWIW, you can specify a >> > >> path using "./abc/efg/hij" (i.e. using a forward slash) on both >> Windows >> > >> /and/ Unix/Linux, whereas Unix does not understand the '\' character >> in >> > >> this context. So the forward slash is system independent. >> > >> >> > >> P. >> > >> >> > >> On 25/02/2026 18:10, Alan wrote: >> > >>> Does Gnuplot offer a system independent way to >> > >>> create directory names relative to the home folder (especially) >> > >>> and also relative to the script folder? >> > >>> >> > >>> I am aware of `system`, but that depends on the OS shell. >> > >>> I'm not a C programmer, but I believe the tricks to retrieve this >> > >>> information in a system independent way are pretty standard. (?) >> > >>> >> > >>> Thank you. >> > >>> >> > >>> _______________________________________________ >> > >>> gnuplot-info mailing list >> > >>> gnu...@li... >> > >>> Membership management via: >> > >> https://lists.sourceforge.net/lists/listinfo/gnuplot-info >> > >> _______________________________________________ >> > >> gnuplot-info mailing list >> > >> gnu...@li... >> > >> Membership management via: >> > >> https://lists.sourceforge.net/lists/listinfo/gnuplot-info >> > >> >> > > _______________________________________________ >> > > gnuplot-info mailing list >> > > gnu...@li... >> > > Membership management via: >> > https://lists.sourceforge.net/lists/listinfo/gnuplot-info >> > >> >> _______________________________________________ >> gnuplot-info mailing list >> gnu...@li... >> Membership management via: >> https://lists.sourceforge.net/lists/listinfo/gnuplot-info >> > |
|
From: Michael S. <Mic...@bo...> - 2026-02-26 18:46:16
|
How about this? michael@argon:~/tmp$ cat p.gnu home = "dogrun" print home home = "`echo $HOME`" print home michael@argon:~/tmp$ gnuplot p.gnu dogrun /home/michael On Thu, Feb 26, 2026 at 10:06 AM Alan <ala...@gm...> wrote: > Thanks for helping to look for a workaround, but I do not think so. > > Too many different computers and people involved. > > Let me ask this differently. > According to the manual (p.64), "The program then looks in the user’s HOME > directory". > So after launching, Gnuplot has already determined the location of the home > directory. > Is there any way to ask Gnuplot for its value (as a string)? > If not, is there any reason for developers to avoid adding such a feature? > > Thanks, Alan > > On Thu, Feb 26, 2026 at 10:51 AM Peter Rockett <p.r...@sh...> > wrote: > > > OK. Is the GNUPLOT_LIB environment variable what you need? Or the > > .gnuplot & GNUPLOT.INI startup files? > > > > P. > > > > On 26/02/2026 14:12, Alan wrote: > > > I would like to have data stored both > > > relative to the script file and more importantly relative to the home > > > directory, > > > and I would like an easy way to find the data on multiple systems > > > where the same relative relationships hold. > > > > > > Most important is being able to find the home directory > > > in the gnuplot script in a system independent way. > > > For example, I'd like my home and work computers > > > to have an output folder that is fixed relative to the home directory, > > > and I'd like Gnuplot to be able to find it without relying on `system`, > > > which requires a different commands depending on the shell. > > > (Powershell or cmd on Windows, vs zsh on Mac, vs bash or dash on Linux, > > > etc.) > > > > > > Also desirable is for the script to be able to find data > > > relative to the script's location, no matter what the > > > current working directory from which Gnuplot is launched. > > > As a simple example, suppose I am in folder `a` and do > > > gnuplot ./gnuplot/myscript.gpi > > > Then the pwd for Gnuplot becomes `a`, not the script directory. > > > In the script, I'd like to ask Gnuplot for the script directory. > > > > > > Hope that's clearer, Alan > > > > > > On Thu, Feb 26, 2026 at 7:34 AM Peter Rockett via gnuplot-info < > > > gnu...@li...> wrote: > > > > > >> Not totally clear of the objective here, but FWIW, you can specify a > > >> path using "./abc/efg/hij" (i.e. using a forward slash) on both > Windows > > >> /and/ Unix/Linux, whereas Unix does not understand the '\' character > in > > >> this context. So the forward slash is system independent. > > >> > > >> P. > > >> > > >> On 25/02/2026 18:10, Alan wrote: > > >>> Does Gnuplot offer a system independent way to > > >>> create directory names relative to the home folder (especially) > > >>> and also relative to the script folder? > > >>> > > >>> I am aware of `system`, but that depends on the OS shell. > > >>> I'm not a C programmer, but I believe the tricks to retrieve this > > >>> information in a system independent way are pretty standard. (?) > > >>> > > >>> Thank you. > > >>> > > >>> _______________________________________________ > > >>> gnuplot-info mailing list > > >>> gnu...@li... > > >>> Membership management via: > > >> https://lists.sourceforge.net/lists/listinfo/gnuplot-info > > >> _______________________________________________ > > >> gnuplot-info mailing list > > >> gnu...@li... > > >> Membership management via: > > >> https://lists.sourceforge.net/lists/listinfo/gnuplot-info > > >> > > > _______________________________________________ > > > gnuplot-info mailing list > > > gnu...@li... > > > Membership management via: > > https://lists.sourceforge.net/lists/listinfo/gnuplot-info > > > > _______________________________________________ > gnuplot-info mailing list > gnu...@li... > Membership management via: > https://lists.sourceforge.net/lists/listinfo/gnuplot-info > |
|
From: Alan <ala...@gm...> - 2026-02-26 18:05:59
|
Thanks for helping to look for a workaround, but I do not think so. Too many different computers and people involved. Let me ask this differently. According to the manual (p.64), "The program then looks in the user’s HOME directory". So after launching, Gnuplot has already determined the location of the home directory. Is there any way to ask Gnuplot for its value (as a string)? If not, is there any reason for developers to avoid adding such a feature? Thanks, Alan On Thu, Feb 26, 2026 at 10:51 AM Peter Rockett <p.r...@sh...> wrote: > OK. Is the GNUPLOT_LIB environment variable what you need? Or the > .gnuplot & GNUPLOT.INI startup files? > > P. > > On 26/02/2026 14:12, Alan wrote: > > I would like to have data stored both > > relative to the script file and more importantly relative to the home > > directory, > > and I would like an easy way to find the data on multiple systems > > where the same relative relationships hold. > > > > Most important is being able to find the home directory > > in the gnuplot script in a system independent way. > > For example, I'd like my home and work computers > > to have an output folder that is fixed relative to the home directory, > > and I'd like Gnuplot to be able to find it without relying on `system`, > > which requires a different commands depending on the shell. > > (Powershell or cmd on Windows, vs zsh on Mac, vs bash or dash on Linux, > > etc.) > > > > Also desirable is for the script to be able to find data > > relative to the script's location, no matter what the > > current working directory from which Gnuplot is launched. > > As a simple example, suppose I am in folder `a` and do > > gnuplot ./gnuplot/myscript.gpi > > Then the pwd for Gnuplot becomes `a`, not the script directory. > > In the script, I'd like to ask Gnuplot for the script directory. > > > > Hope that's clearer, Alan > > > > On Thu, Feb 26, 2026 at 7:34 AM Peter Rockett via gnuplot-info < > > gnu...@li...> wrote: > > > >> Not totally clear of the objective here, but FWIW, you can specify a > >> path using "./abc/efg/hij" (i.e. using a forward slash) on both Windows > >> /and/ Unix/Linux, whereas Unix does not understand the '\' character in > >> this context. So the forward slash is system independent. > >> > >> P. > >> > >> On 25/02/2026 18:10, Alan wrote: > >>> Does Gnuplot offer a system independent way to > >>> create directory names relative to the home folder (especially) > >>> and also relative to the script folder? > >>> > >>> I am aware of `system`, but that depends on the OS shell. > >>> I'm not a C programmer, but I believe the tricks to retrieve this > >>> information in a system independent way are pretty standard. (?) > >>> > >>> Thank you. > >>> > >>> _______________________________________________ > >>> gnuplot-info mailing list > >>> gnu...@li... > >>> Membership management via: > >> https://lists.sourceforge.net/lists/listinfo/gnuplot-info > >> _______________________________________________ > >> gnuplot-info mailing list > >> gnu...@li... > >> Membership management via: > >> https://lists.sourceforge.net/lists/listinfo/gnuplot-info > >> > > _______________________________________________ > > gnuplot-info mailing list > > gnu...@li... > > Membership management via: > https://lists.sourceforge.net/lists/listinfo/gnuplot-info > |
|
From: Patrick D. <pd...@gm...> - 2026-02-26 15:40:10
|
OK, Exactly what I wanted. > > > > > NO, > > set logscale only set a log scale > > I want to have the x values following a log scale like > > > > 0.01 0.1 1 10 100 1000 > > > > I export the function to a file > > Hi Patrick, > Not sure, what exactly you are aiming for... > What about the following? > If you set samples 6, you will get the values you mentioned. > Best, Theo. > > reset session > set logscale x > set samples 11 > set xrange[0.01:1000] > set table $Data > plot '+' u 1 w table > unset table > print $Data > > Result: > 0.01 > 0.0316228 > 0.1 > 0.316228 > 1 > 3.16228 > 10 > 31.6228 > 100 > 316.228 > 1000 > > > > > _______________________________________________ > gnuplot-info mailing list > gnu...@li... > Membership management via: https://lists.sourceforge.net/lists/listinfo/gnuplot-info > |
|
From: Alan <ala...@gm...> - 2026-02-26 14:13:05
|
I would like to have data stored both relative to the script file and more importantly relative to the home directory, and I would like an easy way to find the data on multiple systems where the same relative relationships hold. Most important is being able to find the home directory in the gnuplot script in a system independent way. For example, I'd like my home and work computers to have an output folder that is fixed relative to the home directory, and I'd like Gnuplot to be able to find it without relying on `system`, which requires a different commands depending on the shell. (Powershell or cmd on Windows, vs zsh on Mac, vs bash or dash on Linux, etc.) Also desirable is for the script to be able to find data relative to the script's location, no matter what the current working directory from which Gnuplot is launched. As a simple example, suppose I am in folder `a` and do gnuplot ./gnuplot/myscript.gpi Then the pwd for Gnuplot becomes `a`, not the script directory. In the script, I'd like to ask Gnuplot for the script directory. Hope that's clearer, Alan On Thu, Feb 26, 2026 at 7:34 AM Peter Rockett via gnuplot-info < gnu...@li...> wrote: > Not totally clear of the objective here, but FWIW, you can specify a > path using "./abc/efg/hij" (i.e. using a forward slash) on both Windows > /and/ Unix/Linux, whereas Unix does not understand the '\' character in > this context. So the forward slash is system independent. > > P. > > On 25/02/2026 18:10, Alan wrote: > > Does Gnuplot offer a system independent way to > > create directory names relative to the home folder (especially) > > and also relative to the script folder? > > > > I am aware of `system`, but that depends on the OS shell. > > I'm not a C programmer, but I believe the tricks to retrieve this > > information in a system independent way are pretty standard. (?) > > > > Thank you. > > > > _______________________________________________ > > gnuplot-info mailing list > > gnu...@li... > > Membership management via: > https://lists.sourceforge.net/lists/listinfo/gnuplot-info > _______________________________________________ > gnuplot-info mailing list > gnu...@li... > Membership management via: > https://lists.sourceforge.net/lists/listinfo/gnuplot-info > |
|
From: <th...@gm...> - 2026-02-26 13:37:03
|
>
> NO,
> set logscale only set a log scale
> I want to have the x values following a log scale like
>
> 0.01 0.1 1 10 100 1000
>
> I export the function to a file

Hi Patrick,
Not sure, what exactly you are aiming for...
What about the following?
If you set samples 6, you will get the values you mentioned.
Best, Theo.

reset session
set logscale x
set samples 11
set xrange[0.01:1000]
set table $Data
     plot '+' u 1 w table
unset table
print $Data

Result:
  0.01
  0.0316228
  0.1
  0.316228
  1
  3.16228
  10
  31.6228
  100
  316.228
  1000
|
|
From: Peter R. <p.r...@sh...> - 2026-02-26 12:34:06
|
Not totally clear of the objective here, but FWIW, you can specify a path using "./abc/efg/hij" (i.e. using a forward slash) on both Windows /and/ Unix/Linux, whereas Unix does not understand the '\' character in this context. So the forward slash is system independent. P. On 25/02/2026 18:10, Alan wrote: > Does Gnuplot offer a system independent way to > create directory names relative to the home folder (especially) > and also relative to the script folder? > > I am aware of `system`, but that depends on the OS shell. > I'm not a C programmer, but I believe the tricks to retrieve this > information in a system independent way are pretty standard. (?) > > Thank you. > > _______________________________________________ > gnuplot-info mailing list > gnu...@li... > Membership management via:https://lists.sourceforge.net/lists/listinfo/gnuplot-info |
|
From: Patrick D. <pd...@gm...> - 2026-02-25 22:05:04
|
From: "Norwid Behrnd" <nb...@ya...> > To: gnu...@li... > Cc: "Patrick Dupre" <pd...@gm...> > Subject: Re: [Gnuplot-info] Generatin of function with non linear scale > > Hello Patrick > > On Wed, 25 Feb 2026 22:11:32 +0100 > Patrick Dupre via gnuplot-info <gnu...@li...> wrote: > > > Can I generate a function with x values following a log scale for example? > > You mean, an additional `set logscale x`? NO, set logscale only set a log scale I want to have the x values following a log scale like 0.01 0.1 1 10 100 1000 I export the function to a file > > Regards, > Norwid > |
|
From: Norwid B. <nb...@ya...> - 2026-02-25 21:33:24
|
Hello Patrick On Wed, 25 Feb 2026 22:11:32 +0100 Patrick Dupre via gnuplot-info <gnu...@li...> wrote: > Can I generate a function with x values following a log scale for example? You mean, an additional `set logscale x`? Regards, Norwid |
|
From: Patrick D. <pd...@gm...> - 2026-02-25 21:11:46
|
Hello, when a generate a function, gnuplot use a scale [a:b] with a sampling rate set by the variable sample. Can I generate a function with x values following a log scale for example? Thank =========================================================================== Patrick DUPRÉ | | email: pd...@gm... =========================================================================== |
|
From: Alan <ala...@gm...> - 2026-02-25 18:11:09
|
Does Gnuplot offer a system independent way to create directory names relative to the home folder (especially) and also relative to the script folder? I am aware of `system`, but that depends on the OS shell. I'm not a C programmer, but I believe the tricks to retrieve this information in a system independent way are pretty standard. (?) Thank you. |
|
From: Reginald B. <pul...@ya...> - 2026-02-10 14:37:09
|
 Norwid,
Thank you for a such a detailed answer.  It's not my data.  I'm trying to help someone else and got in over my head.
I will buy the book as I am a long time gnuplot fan.
Have Fun!Reg
    On Monday, February 9, 2026 at 04:14:24 PM CST, Norwid Behrnd <nb...@ya...> wrote:

 Dear Reginald

There are two issues with the data shared by you. 1) There are 16 min between
the first, and the second measurement; subsequently, the interval is 1 min
only.  Either clip the data (and explain why you did), or recollect the data
equidistant in time.

2) Dependent values of column 6 are _much_ away from the values of column 4,
5, and somewhat 7; and again a column 8 and 9. Either break the ordinate, use
a secondary ordinate, or use multiple sub figures to illustrate your findings.
By recollection, the second edition of "Gnuplot in Action" includes inspiring
colorful examples including the corresponding source code.

But since your question is about to get the proverbial foot into the door, I
clipped the raw data to have a file `data.dat`

```data.dat
2 2026/02/05 20:57 26.8 38.02 983.32 13.54 0.21 2.76
3 2026/02/05 20:58 26.81 38.01 983.29 13.55 0.07 2.75
4 2026/02/05 20:59 26.81 38.0 983.28 13.55 0.19 2.75
5 2026/02/05 21:00 26.81 37.98 983.33 13.55 0.21 2.8
6 2026/02/05 21:01 26.81 37.99 983.34 13.55 0.21 2.81
```

with the 9 columns per line separated by one explicit white space.  With focus
on column 8 and 9, my MRE `proximo.gp` is

```proximo.gp
set terminal png
set title "test"
set output "test.png"

set datafile separator whitespace

set xdata time
set timefmt "%Y/%m/%d %H:%M"
set format x ""    # let xticlabels define what is printed
set xtics out nomirror

set format y "%.2f"
set ylabel "values"

# helper: build a two-line label "YYYY/MM/DD\nHH:MM"
lab(i) = sprintf("%s\n%s", strcol(2), strcol(3))

plot "data_02.dat" using (timecolumn(2, "%Y/%m/%d") + \
        timecolumn(3, " %H:%M")):8:xticlabels(lab($0)) \
        with lines title "col8", \
  "" using (timecolumn(2, "%Y/%m/%d") + \
      timecolumn(3, " %H:%M")):9 with lines title "col9"

```

to yield the illustration (`test.png`) attached by the call of

```bash
$ gnuplot proximo.gp
```

with gnuplot version gnuplot 6.0 patchlevel 3 as currently packaged for Linux
Debian 14/forky (branch testing).  I added a couple of backslashes to break
lines otherwise the email editor would break visually (and in consequence, in
function).  One can do better (e.g., increase of the canvas dimension -- I
forgot how -- to prevent the time marks so close to the border), though.

Regards,
Norwid

https://www.manning.com/books/gnuplot-in-action-second-edition
|
|
From: Norwid B. <nb...@ya...> - 2026-02-09 22:34:55
|
Dear Reginald

There are two issues with the data shared by you. 1) There are 16 min between
the first, and the second measurement; subsequently, the interval is 1 min
only.  Either clip the data (and explain why you did), or recollect the data
equidistant in time.

2) Dependent values of column 6 are _much_ away from the values of column 4,
5, and somewhat 7; and again a column 8 and 9. Either break the ordinate, use
a secondary ordinate, or use multiple sub figures to illustrate your findings.
By recollection, the second edition of "Gnuplot in Action" includes inspiring
colorful examples including the corresponding source code.

But since your question is about to get the proverbial foot into the door, I
clipped the raw data to have a file `data.dat`

```data.dat
2 2026/02/05 20:57 26.8 38.02 983.32 13.54 0.21 2.76
3 2026/02/05 20:58 26.81 38.01 983.29 13.55 0.07 2.75
4 2026/02/05 20:59 26.81 38.0 983.28 13.55 0.19 2.75
5 2026/02/05 21:00 26.81 37.98 983.33 13.55 0.21 2.8
6 2026/02/05 21:01 26.81 37.99 983.34 13.55 0.21 2.81
```

with the 9 columns per line separated by one explicit white space.  With focus
on column 8 and 9, my MRE `proximo.gp` is

```proximo.gp
set terminal png
set title "test"
set output "test.png"

set datafile separator whitespace

set xdata time
set timefmt "%Y/%m/%d %H:%M"
set format x ""    # let xticlabels define what is printed
set xtics out nomirror

set format y "%.2f"
set ylabel "values"

# helper: build a two-line label "YYYY/MM/DD\nHH:MM"
lab(i) = sprintf("%s\n%s", strcol(2), strcol(3))

plot "data_02.dat" using (timecolumn(2, "%Y/%m/%d") + \
         timecolumn(3, " %H:%M")):8:xticlabels(lab($0)) \
         with lines title "col8", \
   "" using (timecolumn(2, "%Y/%m/%d") + \
      timecolumn(3, " %H:%M")):9 with lines title "col9"

```

to yield the illustration (`test.png`) attached by the call of

```bash
$ gnuplot proximo.gp
```

with gnuplot version gnuplot 6.0 patchlevel 3 as currently packaged for Linux
Debian 14/forky (branch testing).  I added a couple of backslashes to break
lines otherwise the email editor would break visually (and in consequence, in
function).  One can do better (e.g., increase of the canvas dimension -- I
forgot how -- to prevent the time marks so close to the border), though.

Regards,
Norwid

https://www.manning.com/books/gnuplot-in-action-second-edition
|
|
From: Reginald B. <pul...@ya...> - 2026-02-09 17:25:28
|
I've tried modifying timedat.dem to plot the following without success: 1 2026/02/05 20:41 26.81 38.09 983.28 13.53 0.17 2.77 2 2026/02/05 20:57 26.8 38.02 983.32 13.54 0.21 2.76 3 2026/02/05 20:58 26.81 38.01 983.29 13.55 0.07 2.75 4 2026/02/05 20:59 26.81 38.0 983.28 13.55 0.19 2.75 5 2026/02/05 21:00 26.81 37.98 983.33 13.55 0.21 2.8 6 2026/02/05 21:01 26.81 37.99 983.34 13.55 0.21 2.81 I volunteered to help someone else and painted myself in a corner. Would like to show time and date on the X axis. The first demo would be fine, but I've not been able to reformat the data into something gnuplot will accept. Not clear whytimedat.dat works and my version won't Thanks,Reg |
|
From: Robert H. <he...@de...> - 2026-02-08 16:43:56
|
At Sun, 8 Feb 2026 07:17:35 -0500 (EST) Robert Heller <he...@de...> wrote: > > None of this helps. The X Tick labels are still the numberical indexes and > not the text in column of the data file. > I found my problem: doing "1:xtick(1)" is wrong! I moved the ":xtic(1)" elsewhere in the using list and presto, things work. > At Sun, 8 Feb 2026 11:38:29 +0100 Norwid Behrnd <nb...@ya...> wrote: > > > > > Dear Robert > > > > The example shared by you includes three consecutive lines relevant to the > > management of xtics: > > > > > set xtics border in scale 0,0 nomirror rotate by -45 autojustify > > > set xtics norangelimit > > > set xtics () > > > > By `set xtics scale 0,0` you however set them invisible. Compare for example > > the result of > > > > ``` > > set terminal png > > set output "test_01.png" > > set title "test 01" > > > > set xtics in scale 0,0 > > plot sin(x) > > ``` > > > > with (an exaggerated example) > > > > ``` > > set terminal png > > set output "test_02.png" > > set title "test 02" > > > > set xtics in scale 10,0 > > plot sin(x) > > ``` > > > > Equally, compare with the first example "US immigration from Europe by decade" > > on <https://gnuplot.sourceforge.net/demo_5.4/histograms2.html> -- sometimes the > > tics extend beyond the bars (e.g., 1931--1940, Northern Europe) to be visible, > > while e.g., about 1901--1910 they are not. Here, `set xtics out` yields xtics > > which don't enter the first quadrant and hence are not affected by the > > histogram's bars. > > > > In your example, the annotations to the abscissa are short; this is the reason > > why I think to use `set xtics out` without a `rotate by -45` provides a result > > easier to read and > > > > ``` > > set xtics out border nomirror autojustify > > set xtics norangelimit > > ``` > > > > might suffice. Note `set xtics ()` can void your earlier list of instructions > > about the xtics. > > > > Best regards, > > > > Norwid > > > > > > > -- Robert Heller -- Cell: 413-658-7953 GV: 978-633-5364 Deepwoods Software -- Custom Software Services http://www.deepsoft.com/ -- Linux Administration Services he...@de... -- Webhosting Services |
|
From: Robert H. <he...@de...> - 2026-02-08 15:56:11
|
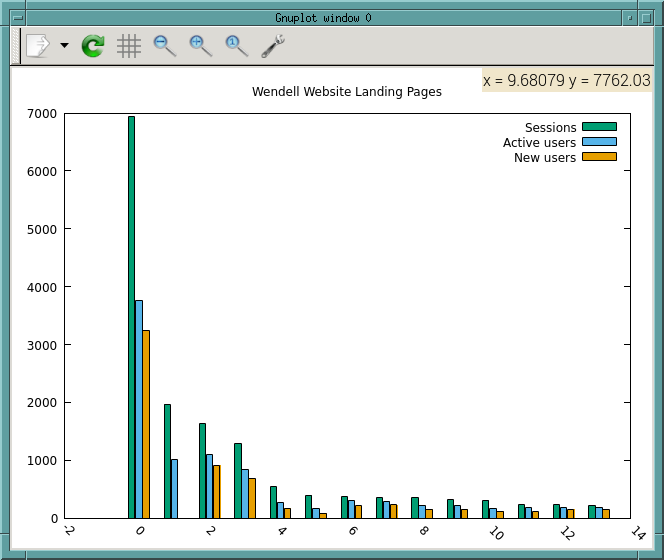
None of this helps. The X Tick labels are still the numberical indexes and not the text in column of the data file. At Sun, 8 Feb 2026 11:38:29 +0100 Norwid Behrnd <nb...@ya...> wrote: > > Dear Robert > > The example shared by you includes three consecutive lines relevant to the > management of xtics: > > > set xtics border in scale 0,0 nomirror rotate by -45 autojustify > > set xtics norangelimit > > set xtics () > > By `set xtics scale 0,0` you however set them invisible. Compare for example > the result of > > ``` > set terminal png > set output "test_01.png" > set title "test 01" > > set xtics in scale 0,0 > plot sin(x) > ``` > > with (an exaggerated example) > > ``` > set terminal png > set output "test_02.png" > set title "test 02" > > set xtics in scale 10,0 > plot sin(x) > ``` > > Equally, compare with the first example "US immigration from Europe by decade" > on <https://gnuplot.sourceforge.net/demo_5.4/histograms2.html> -- sometimes the > tics extend beyond the bars (e.g., 1931--1940, Northern Europe) to be visible, > while e.g., about 1901--1910 they are not. Here, `set xtics out` yields xtics > which don't enter the first quadrant and hence are not affected by the > histogram's bars. > > In your example, the annotations to the abscissa are short; this is the reason > why I think to use `set xtics out` without a `rotate by -45` provides a result > easier to read and > > ``` > set xtics out border nomirror autojustify > set xtics norangelimit > ``` > > might suffice. Note `set xtics ()` can void your earlier list of instructions > about the xtics. > > Best regards, > > Norwid > > > -- Robert Heller -- Cell: 413-658-7953 GV: 978-633-5364 Deepwoods Software -- Custom Software Services http://www.deepsoft.com/ -- Linux Administration Services he...@de... -- Webhosting Services |
|
From: Norwid B. <nb...@ya...> - 2026-02-08 11:29:36
|
Dear Robert The example shared by you includes three consecutive lines relevant to the management of xtics: > set xtics border in scale 0,0 nomirror rotate by -45 autojustify > set xtics norangelimit > set xtics () By `set xtics scale 0,0` you however set them invisible. Compare for example the result of ``` set terminal png set output "test_01.png" set title "test 01" set xtics in scale 0,0 plot sin(x) ``` with (an exaggerated example) ``` set terminal png set output "test_02.png" set title "test 02" set xtics in scale 10,0 plot sin(x) ``` Equally, compare with the first example "US immigration from Europe by decade" on <https://gnuplot.sourceforge.net/demo_5.4/histograms2.html> -- sometimes the tics extend beyond the bars (e.g., 1931--1940, Northern Europe) to be visible, while e.g., about 1901--1910 they are not. Here, `set xtics out` yields xtics which don't enter the first quadrant and hence are not affected by the histogram's bars. In your example, the annotations to the abscissa are short; this is the reason why I think to use `set xtics out` without a `rotate by -45` provides a result easier to read and ``` set xtics out border nomirror autojustify set xtics norangelimit ``` might suffice. Note `set xtics ()` can void your earlier list of instructions about the xtics. Best regards, Norwid |
|
From: Robert H. <he...@de...> - 2026-02-07 20:47:25
|
I downloaded the file at https://gnuplot.sourceforge.net/demo_5.4/histograms.2.gnu and edited to suit my data file: #!/usr/bin/gnuplot -persist set datafile separator comma set datafile columnheaders set boxwidth 0.9 absolute set style fill solid 1.00 border lt -1 set key fixed right top vertical Right noreverse noenhanced autotitle nobox set style histogram clustered gap 1 title textcolor lt -1 unset parametric set datafile missing '-' set style data histograms set xtics border in scale 0,0 nomirror rotate by -45 autojustify set xtics norangelimit set xtics () set title "Wendell Website Landing Pages" set xrange [ * : * ] noreverse writeback set x2range [ * : * ] noreverse writeback set yrange [ 0.00000 : 7000. ] noreverse writeback set y2range [ * : * ] noreverse writeback set zrange [ * : * ] noreverse writeback set cbrange [ * : * ] noreverse writeback set rrange [ * : * ] noreverse writeback set colorbox vertical origin screen 0.9, 0.2 size screen 0.05, 0.6 front noinvert bdefault NO_ANIMATION = 1 plot "WendellWebsite-Jan1-Dec31-2025-Landing_page_Landing_page.csv" \ using 1:xticlabels(1), '' u 2 ti col, '' u 3 ti col, '' u 4 ti col But while it *mostly* works, it does not do the xtic labels, as shown in this screen shot: https://www.deepsoft.com/wp-content/uploads/2026/02/Screenshot-from-2026-02-07-15-41-28.png What am I doing wrong? The data file looks like this: # ---------------------------------------- # Landing page: Landing page # Account: www.wendellmass.us # Property: http://www.wendellmass.us - GA4 # ---------------------------------------- # # All Users # Start date: 20250101 # End date: 20251231 Landing page,Sessions,Active users,New users,Average engagement time per session,Key events,Total revenue,Session key event rate /,6936,3766,3239,71.99423298731257,0,0,0 (not set),1972,1005,0,12.278904665314402,0,0,0 /departments/library,1629,1092,918,36.09821976672806,0,0,0 /departments/recycling-and-transfer-station,1282,842,682,23.013260530421217,0,0,0 /town-government,543,273,175,93.43093922651934,0,0,0 /departments/public-meetings,397,160,86,69.7632241813602,0,0,0 /departments,367,304,211,116.20708446866485,0,0,0 /departments/property-assessment,351,291,233,34.69230769230769,0,0,0 /online-payment-bill-lookup,351,219,156,26.974358974358974,0,0,0 /departments/tax-collector,316,220,150,42.08227848101266,0,0,0 /departments/building-department,304,170,117,66.35197368421052,0,0,0 /departments/town-clerk,233,176,112,37.927038626609445,0,0,0 /good-neighbors,228,179,151,38.31140350877193,0,0,0 /jobs,223,182,144,27.60089686098655,0,0,0 -- Robert Heller -- Cell: 413-658-7953 GV: 978-633-5364 Deepwoods Software -- Custom Software Services http://www.deepsoft.com/ -- Linux Administration Services he...@de... -- Webhosting Services |
|
From: Wolfgang D. <wol...@da...> - 2025-12-28 10:08:32
|
Dear Gnuplot-team, until 6.0.3 you released Gnuplot for Windows also as ZIP/7z files (gp603-win64-mingw.zip / gp603-win64-mingw.7z) - do you plan that for 6.0.4 too? Or only the exe-installer? Best regards, Wolfgang |
|
From: Ethan M. <eam...@gm...> - 2025-12-03 18:59:36
|
set object circle at screen 0.9,screen 0.9 size 0.2 \
      fillstyle solid border lc rgb "#000000" fillcolor "orange"

On Wed, Dec 3, 2025 at 10:46 AM Geoff Kaniuk <ge...@ka...> wrote:
>
> I wish to plot a coloured disc outside the plot area.
>
> For example, the set object command:
>      set object circle at screen 0.9,screen 0.9 size 0.2 fc rgb "#000000"
> produced a circle with black boundary, white interior.
>
> fc is the fillcolor
>
> Is there an option to set the interior of the circle to any chosen colour?
> --
> Geoff
>
>
>
> _______________________________________________
> gnuplot-info mailing list
> gnu...@li...
> Membership management via: https://lists.sourceforge.net/lists/listinfo/gnuplot-info
|
|
From: Geoff K. <ge...@ka...> - 2025-12-03 18:46:09
|
I wish to plot a coloured disc outside the plot area.

For example, the set object command:
     set object circle at screen 0.9,screen 0.9 size 0.2 fc rgb "#000000"
produced a circle with black boundary, white interior.

fc is the fillcolor

Is there an option to set the interior of the circle to any chosen colour?
--
Geoff
|
|
From: Geoff K. <ge...@ka...> - 2025-12-03 17:10:23
|
Sorry, I missed the fillstyle property:
set object circle
  at screen 0.9,screen 0.9 size 0.2 fc rgb "#000000" fs solid
works!

Geoff


-------- Forwarded Message --------
Subject: PlottingFilledCircleOutsidePlotArea
Date: Wed, 3 Dec 2025 15:18:28 +0000
From: Geoff Kaniuk <ge...@ka...>
To: gnu...@li...

I wish to plot a coloured disc outside the plot area.

For example, the set object command:
     set object circle at screen 0.9,screen 0.9 size 0.2 fc rgb "#000000"
produced a circle with black boundary, white interior.

fc is the fillcolor

Is there an option to set the interior of the circle to any chosen colour?
--
Geoff
|
635 messages has been excluded from this view by a project administrator.

