
Menu
▾
▴
gnuplot-beta
|
From: Shigeharu T. <sh...@ie...> - 2010-02-23 10:46:08
|
shige 02/23 2010
----------------

Recently, a new book for gnuplot-4.2 was published last year,
written by M.Yamamoto in Japanese. In it, he pointed out some
problems about differences between the gnuplot binary and its
help.


1) Gnuplot help says as the following (section "binary matrix"):

   which are converted into triplets:
         <x0> <y0> <z0,0>
         <x0> <y1> <z0,1>
         <x0> <y2> <z0,2>
          :    :     :
         <x0> <yN> <z0,N>

         <x1> <y0> <z1,0>
         <x1> <y1> <z1,1>
          :    :     :

However, gnuplot seems to treat it as the following:

         <y0> <x0> <z0,0>
         <y0> <x1> <z0,1>
         <y0> <x2> <z0,2>
          :    :     :
         <y0> <xN> <z0,N>

         <y1> <x0> <z1,0>
         <y1> <x1> <z1,1>
          :    :     :

I checked it by

  splot "binary.dat" binary matrix every :::0::1 w l

for an asymmetric binary data "binary.dat".


2) Help for png/jpeg/png terminal says:

      set terminal gif medium size 640,480 \
                       xffffff x000000 x404040 \
                       xff0000 xffa500 x66cdaa xcdb5cd \
                       xadd8e6 x0000ff xdda0dd x9500d3    # defaults

However these colors are not the defaults of the terminals.
I think the comment "#defaults" should be removed.


3) Gnuplot help says as the following ("set datafile missing"):

   Example:
         set datafile missing "?"
         set style data lines
         plot '-'
            1 10
            2 20
            3 ?
            4 40
            5 50
            e
    ....
   The first `plot` will recognize only the first datum in the "3 ?" line.  It
   will use the single-datum-on-a-line convention that the line number is "x"
   and the datum is "y", so the point will be plotted (in this case erroneously)
   at (2,3).

However, it, mentioned above, is the behavior when not using 'set
datafile missing "?"'. Using 'set datafile missing "?"', the line
"3 ?" will be ignored correctly.


4) Gnuplot help says as the following (section "variables"):

 Valid names are the same as in most programming languages: they must begin
 with a letter, but subsequent characters may be letters, digits, "$", or "_".

However, we can not use the character "$" as the part of the
variable name.

+========================================================+
 Shigeharu TAKENO     NIigata Institute of Technology
                       kashiwazaki,Niigata 945-1195 JAPAN
 sh...@ie...   TEL(&FAX): +81-257-22-8161
+========================================================+
|
|
From: Ethan M. <merritt@u.washington.edu> - 2010-02-23 20:09:06
|
On Tuesday 23 February 2010 02:45:54 Shigeharu TAKENO wrote: > shige 02/23 2010 > ---------------- > > Recently, a new book for gnuplot-4.2 was published last year, > written by M.Yamamoto in Japanese. In it, he pointed out some > problems about differences between the gnuplot binary and its > help. > > 2) Help for png/jpeg/png terminal says: > > set terminal gif medium size 640,480 \ > xffffff x000000 x404040 \ > xff0000 xffa500 x66cdaa xcdb5cd \ > xadd8e6 x0000ff xdda0dd x9500d3 # defaults > > However these colors are not the defaults of the terminals. > I think the comment "#defaults" should be removed. You are correct. This entire mechanism is obsolete. In fact, the command does not seem to work as documented in the current 4.4 or 4.5 cvs source, even apart from issue of the default values. [and what did it ever mean "the x and y axis color"?? Was it ever possible to use colors for the x and y axes that were different from the border color?] I suggest that we should remove this section from the documentation. Instead we will cross-reference the sections explaining that colors can now be specified for all terminals using commands such as plot ... lc rgbcolor "#RRGGBB" set border lc rgbcolor "#RRGGBB" or set linetype N lc rgbcolor '#RRGGBB" The png/gif/jpeg terminals can continue to accept this terminal option for backwards compatibility with old scripts even though it is no longer recommended, documented, or supported. However, interpretation of the very first color as the background color must remain. There is currently no other way to set the background color correctly for the png and jpeg terminals. It would be reasonable to add new command "set background", but we don't have such a thing now. Ethan |
|
From: Ethan M. <merritt@u.washington.edu> - 2010-02-23 20:16:12
|
On Tuesday 23 February 2010 02:45:54 Shigeharu TAKENO wrote:
> 3) Gnuplot help says as the following ("set datafile missing"):
>
>    Example:
>          set datafile missing "?"
>          set style data lines
>          plot '-'
>             1 10
>             2 20
>             3 ?
>             4 40
>             5 50
>             e
>     ....
>    The first `plot` will recognize only the first datum in the "3 ?" line.  It
>    will use the single-datum-on-a-line convention that the line number is "x"
>    and the datum is "y", so the point will be plotted (in this case erroneously)
>    at (2,3).
>
> However, it, mentioned above, is the behavior when not using 'set
> datafile missing "?"'. Using 'set datafile missing "?"', the line
> "3 ?" will be ignored correctly.

Yes. This could be stated more clearly in the documentation.
We should try to improve the wording.

	Ethan
|
|
From: Ethan M. <merritt@u.washington.edu> - 2010-02-24 20:56:11
|
On Tuesday 23 February 2010 02:45:54 Shigeharu TAKENO wrote: > 4) Gnuplot help says as the following (section "variables"): > > Valid names are the same as in most programming languages: they must begin > with a letter, but subsequent characters may be letters, digits, "$", or "_". > > However, we can not use the character "$" as the part of the > variable name. You are right. I will make this correction in the documentation. I wonder why or when this changed? It must have been a long time ago. This is interesting, because I think it means we could use $ as an operator if necessary. Ethan |
|
From: Shigeharu T. <sh...@ie...> - 2010-02-24 23:55:05
|
shige 02/25 2010 ---------------- I wrote: | 1) Gnuplot help says as the following (section "binary matrix"): | | which are converted into triplets: | <x0> <y0> <z0,0> | <x0> <y1> <z0,1> | <x0> <y2> <z0,2> | : : : | <x0> <yN> <z0,N> | | <x1> <y0> <z1,0> | <x1> <y1> <z1,1> | : : : | | However, gnuplot seems to treat it as the following: | | <y0> <x0> <z0,0> | <y0> <x1> <z0,1> | <y0> <x2> <z0,2> | : : : | <y0> <xN> <z0,N> | | <y1> <x0> <z1,0> | <y1> <x1> <z1,1> | : : : | | I checked it by | | splot "binary.dat" binary matrix every :::0::1 w l | | for an asymmetric binary data "binary.dat". I prepared sample scripts, data, and results. See http://takeno.iee.niit.ac.jp/~shige/unix/gnuplot/data/mkbin.c http://takeno.iee.niit.ac.jp/~shige/unix/gnuplot/data/mkbin.gp http://takeno.iee.niit.ac.jp/~shige/unix/gnuplot/data/mkbin1.gif http://takeno.iee.niit.ac.jp/~shige/unix/gnuplot/data/mkbin2.gif +========================================================+ Shigeharu TAKENO NIigata Institute of Technology kashiwazaki,Niigata 945-1195 JAPAN sh...@ie... TEL(&FAX): +81-257-22-8161 +========================================================+ |
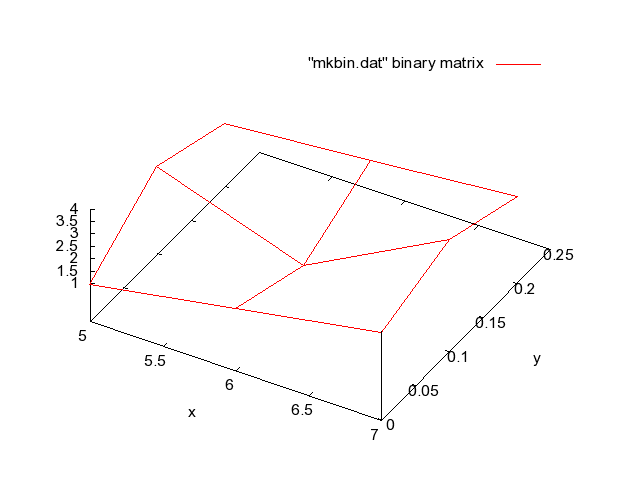
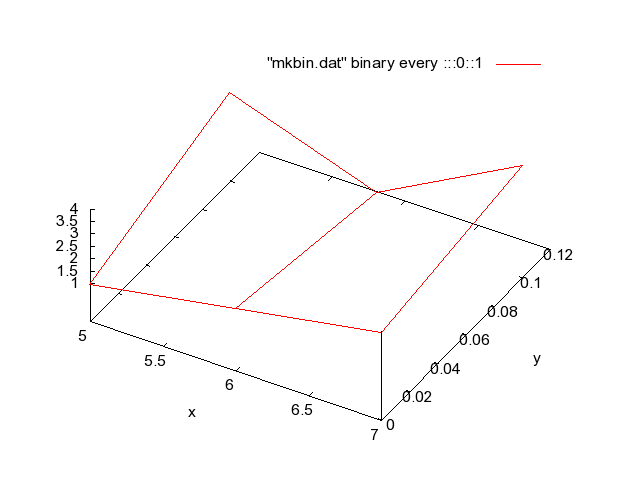
|
From: Shigeharu T. <sh...@ie...> - 2010-02-25 02:20:15
|
shige 02/25 2010 ---------------- I wrote: | I prepared sample scripts, data, and results. See | | http://takeno.iee.niit.ac.jp/~shige/unix/gnuplot/data/mkbin.c | http://takeno.iee.niit.ac.jp/~shige/unix/gnuplot/data/mkbin.gp | http://takeno.iee.niit.ac.jp/~shige/unix/gnuplot/data/mkbin1.gif | http://takeno.iee.niit.ac.jp/~shige/unix/gnuplot/data/mkbin2.gif I explane them. mkbin.c make the following binary matrix data: 3.0 5.0 6.0 7.0 (<N+1> <y0> <y1> <y2>) 0.0 1.0 2.0 3.0 ( <x0> <z0,0> <z0,1> <z0,2>) 0.1 3.0 1.0 4.0 ( <x1> <z1,0> <z1,1> <z1,2>) 0.2 2.0 2.5 3.0 ( <x2> <z2,0> <z2,1> <z2,2>) Gnuplot script mkbin.gp makes images mkbin1.gif and mkbin2.gif from the data made by mkbin.c. Gnuplot.doc says that gnuplot treat it as the following: 0.0 5.0 1.0 0.0 6.0 2.0 0.0 7.0 3.0 0.1 5.0 3.0 0.1 6.0 1.0 0.1 7.0 4.0 0.2 5.0 2.0 0.2 6.0 2.5 0.2 7.0 3.0 However, images mkbin1.gif and mkbin2.gif show that these are made from the data 5.0 0.0 1.0 6.0 0.0 2.0 7.0 0.0 3.0 5.0 0.1 3.0 6.0 0.1 1.0 7.0 0.1 4.0 5.0 0.2 2.0 6.0 0.2 2.5 7.0 0.2 3.0 Moreover, I found a problem in these tests. The following script ! ./mkbin > mkbin.dat splot "mkbin.dat" binary matrix with lines works. But, splot "< ./mkbin" binary matrix with lines does not work and gnuplot says "line 1: Data file is empty". OS: Solaris 9 (sparc) CC: gcc-3.4.3 gnuplot: gnuplot-4.5 (CVS version) +========================================================+ Shigeharu TAKENO NIigata Institute of Technology kashiwazaki,Niigata 945-1195 JAPAN sh...@ie... TEL(&FAX): +81-257-22-8161 +========================================================+ |
|
From: Hans-Bernhard B. <HBB...@t-...> - 2010-02-25 21:04:36
|
Ethan Merritt wrote: > On Tuesday 23 February 2010 02:45:54 Shigeharu TAKENO wrote: >> However, we can not use the character "$" as the part of the >> variable name. > > You are right. I will make this correction in the documentation. > > I wonder why or when this changed? I don't recall when, but the "why" is pretty obvious: we use $ as an operator for 'call' arguments and as an abbreviation of column(). |
|
From: Ethan M. <merritt@u.washington.edu> - 2010-02-25 22:51:02
|
On Thursday 25 February 2010 13:04:32 Hans-Bernhard Bröker wrote: > Ethan Merritt wrote: > > On Tuesday 23 February 2010 02:45:54 Shigeharu TAKENO wrote: > > >> However, we can not use the character "$" as the part of the > >> variable name. > > > > You are right. I will make this correction in the documentation. > > > > I wonder why or when this changed? > > I don't recall when, but the "why" is pretty obvious: we use $ as an > operator for 'call' arguments and as an abbreviation of column(). True. I was thinking it might have had something to do with VMS support, as VMS commonly uses $ as a prefix or separator in variable names. |
|
From: Ethan M. <merritt@u.washington.edu> - 2010-02-26 05:44:19
|
On Wednesday 24 February 2010, Shigeharu TAKENO wrote: > shige 02/25 2010 > ---------------- > > I wrote: > | I prepared sample scripts, data, and results. See > | > | http://takeno.iee.niit.ac.jp/~shige/unix/gnuplot/data/mkbin.c > | http://takeno.iee.niit.ac.jp/~shige/unix/gnuplot/data/mkbin.gp > | http://takeno.iee.niit.ac.jp/~shige/unix/gnuplot/data/mkbin1.gif > | http://takeno.iee.niit.ac.jp/~shige/unix/gnuplot/data/mkbin2.gif > > I explane them. mkbin.c make the following binary matrix data: > > 3.0 5.0 6.0 7.0 (<N+1> <y0> <y1> <y2>) > 0.0 1.0 2.0 3.0 ( <x0> <z0,0> <z0,1> <z0,2>) > 0.1 3.0 1.0 4.0 ( <x1> <z1,0> <z1,1> <z1,2>) > 0.2 2.0 2.5 3.0 ( <x2> <z2,0> <z2,1> <z2,2>) > > Gnuplot script mkbin.gp makes images mkbin1.gif and mkbin2.gif > from the data made by mkbin.c. > > Gnuplot.doc says that gnuplot treat it as the following: > > 0.0 5.0 1.0 > 0.0 6.0 2.0 > 0.0 7.0 3.0 > > 0.1 5.0 3.0 > 0.1 6.0 1.0 > 0.1 7.0 4.0 > > 0.2 5.0 2.0 > 0.2 6.0 2.5 > 0.2 7.0 3.0 > > However, images mkbin1.gif and mkbin2.gif show that these are > made from the data > > 5.0 0.0 1.0 > 6.0 0.0 2.0 > 7.0 0.0 3.0 > > 5.0 0.1 3.0 > 6.0 0.1 1.0 > 7.0 0.1 4.0 > > 5.0 0.2 2.0 > 6.0 0.2 2.5 > 7.0 0.2 3.0 I confirm these results, running on linux. Could you please start a new bug tracker entry for this on SourceForge, and upload the mkbin.c and mkbin.gp files to go with it? > Moreover, I found a problem in these tests. The following script > > ! ./mkbin > mkbin.dat > splot "mkbin.dat" binary matrix with lines > > works. But, > > splot "< ./mkbin" binary matrix with lines > > does not work and gnuplot says "line 1: Data file is empty". The binary file routines use fseek(), which will not work on piped input. I do not know if the code can be re-written so as to not use fseek(). And yes, I can see from the input code in datafile.c routine df_determine_matrix_info() that it reads x across the top and y down the left column. So the code disagrees with the documentation. To me the layout described by the documentation is more natural, but that is not what the code implements. Work-around: splot "mkbin.dat" binary matrix using 2:1:3 with lines I expected the "transpose" keyword to work also, but apparently it is broken. Sigh. Any volunteers to re-write the binary file code? If not, should we re-write the documentation? |
|
From: Shigeharu T. <sh...@ie...> - 2010-02-26 08:44:19
|
shige 02/26 2010
----------------

Ethan Merritt <merritt@u.washington.edu> wrote:
| Could you please start a new bug tracker entry for this on SourceForge,
| and upload the mkbin.c and mkbin.gp files to go with it?

OK, I will do.

| The binary file routines use fseek(), which will not work on
| piped input.  I do not know if the code can be re-written so
| as to not use fseek().

To workaround, to use temporary file having the data of piped
input. But, I think it is better to add the comment for it to the
the document than to use mktemp().

| To me the layout described by the documentation is more natural,
| but that is not what the code implements.

I agree with you.

| Work-around:
|    splot "mkbin.dat" binary matrix using 2:1:3 with lines

I confirm it.

+========================================================+
 Shigeharu TAKENO     NIigata Institute of Technology
                       kashiwazaki,Niigata 945-1195 JAPAN
 sh...@ie...   TEL(&FAX): +81-257-22-8161
+========================================================+
|

