
Menu
▾
▴
gnuplot-beta — Developers and beta testers of new gnuplot code
You can subscribe to this list here.
| 2001 |
Jan
|
Feb
(1) |
Mar
|
Apr
|
May
|
Jun
|
Jul
(1) |
Aug
|
Sep
|
Oct
|
Nov
|
Dec
|
|---|---|---|---|---|---|---|---|---|---|---|---|---|
| 2002 |
Jan
(1) |
Feb
|
Mar
|
Apr
|
May
|
Jun
|
Jul
(1) |
Aug
(1) |
Sep
|
Oct
|
Nov
(1) |
Dec
|
| 2003 |
Jan
|
Feb
|
Mar
|
Apr
|
May
|
Jun
|
Jul
(1) |
Aug
(1) |
Sep
|
Oct
(83) |
Nov
(57) |
Dec
(111) |
| 2004 |
Jan
(38) |
Feb
(121) |
Mar
(107) |
Apr
(241) |
May
(102) |
Jun
(190) |
Jul
(239) |
Aug
(158) |
Sep
(184) |
Oct
(193) |
Nov
(47) |
Dec
(68) |
| 2005 |
Jan
(190) |
Feb
(105) |
Mar
(99) |
Apr
(65) |
May
(92) |
Jun
(250) |
Jul
(197) |
Aug
(128) |
Sep
(101) |
Oct
(183) |
Nov
(186) |
Dec
(42) |
| 2006 |
Jan
(102) |
Feb
(122) |
Mar
(154) |
Apr
(196) |
May
(181) |
Jun
(281) |
Jul
(310) |
Aug
(198) |
Sep
(145) |
Oct
(188) |
Nov
(134) |
Dec
(90) |
| 2007 |
Jan
(134) |
Feb
(181) |
Mar
(157) |
Apr
(57) |
May
(81) |
Jun
(204) |
Jul
(60) |
Aug
(37) |
Sep
(17) |
Oct
(90) |
Nov
(122) |
Dec
(72) |
| 2008 |
Jan
(130) |
Feb
(108) |
Mar
(160) |
Apr
(38) |
May
(83) |
Jun
(42) |
Jul
(75) |
Aug
(16) |
Sep
(71) |
Oct
(57) |
Nov
(59) |
Dec
(152) |
| 2009 |
Jan
(73) |
Feb
(213) |
Mar
(67) |
Apr
(40) |
May
(46) |
Jun
(82) |
Jul
(73) |
Aug
(57) |
Sep
(108) |
Oct
(36) |
Nov
(153) |
Dec
(77) |
| 2010 |
Jan
(42) |
Feb
(171) |
Mar
(150) |
Apr
(6) |
May
(22) |
Jun
(34) |
Jul
(31) |
Aug
(38) |
Sep
(32) |
Oct
(59) |
Nov
(13) |
Dec
(62) |
| 2011 |
Jan
(114) |
Feb
(139) |
Mar
(126) |
Apr
(51) |
May
(53) |
Jun
(29) |
Jul
(41) |
Aug
(29) |
Sep
(35) |
Oct
(87) |
Nov
(42) |
Dec
(20) |
| 2012 |
Jan
(111) |
Feb
(66) |
Mar
(35) |
Apr
(59) |
May
(71) |
Jun
(32) |
Jul
(11) |
Aug
(48) |
Sep
(60) |
Oct
(87) |
Nov
(16) |
Dec
(38) |
| 2013 |
Jan
(5) |
Feb
(19) |
Mar
(41) |
Apr
(47) |
May
(14) |
Jun
(32) |
Jul
(18) |
Aug
(68) |
Sep
(9) |
Oct
(42) |
Nov
(12) |
Dec
(10) |
| 2014 |
Jan
(14) |
Feb
(139) |
Mar
(137) |
Apr
(66) |
May
(72) |
Jun
(142) |
Jul
(70) |
Aug
(31) |
Sep
(39) |
Oct
(98) |
Nov
(133) |
Dec
(44) |
| 2015 |
Jan
(70) |
Feb
(27) |
Mar
(36) |
Apr
(11) |
May
(15) |
Jun
(70) |
Jul
(30) |
Aug
(63) |
Sep
(18) |
Oct
(15) |
Nov
(42) |
Dec
(29) |
| 2016 |
Jan
(37) |
Feb
(48) |
Mar
(59) |
Apr
(28) |
May
(30) |
Jun
(43) |
Jul
(47) |
Aug
(14) |
Sep
(21) |
Oct
(26) |
Nov
(10) |
Dec
(2) |
| 2017 |
Jan
(26) |
Feb
(27) |
Mar
(44) |
Apr
(11) |
May
(32) |
Jun
(28) |
Jul
(75) |
Aug
(45) |
Sep
(35) |
Oct
(285) |
Nov
(99) |
Dec
(16) |
| 2018 |
Jan
(8) |
Feb
(8) |
Mar
(42) |
Apr
(35) |
May
(23) |
Jun
(12) |
Jul
(16) |
Aug
(11) |
Sep
(8) |
Oct
(16) |
Nov
(5) |
Dec
(8) |
| 2019 |
Jan
(9) |
Feb
(28) |
Mar
(4) |
Apr
(10) |
May
(7) |
Jun
(4) |
Jul
(4) |
Aug
|
Sep
(4) |
Oct
|
Nov
(23) |
Dec
(3) |
| 2020 |
Jan
(19) |
Feb
(3) |
Mar
(22) |
Apr
(17) |
May
(10) |
Jun
(69) |
Jul
(18) |
Aug
(23) |
Sep
(25) |
Oct
(11) |
Nov
(20) |
Dec
(9) |
| 2021 |
Jan
(1) |
Feb
(7) |
Mar
(9) |
Apr
|
May
(1) |
Jun
(8) |
Jul
(6) |
Aug
(8) |
Sep
(7) |
Oct
|
Nov
(2) |
Dec
(23) |
| 2022 |
Jan
(23) |
Feb
(9) |
Mar
(9) |
Apr
|
May
(8) |
Jun
(1) |
Jul
(6) |
Aug
(8) |
Sep
(30) |
Oct
(5) |
Nov
(4) |
Dec
(6) |
| 2023 |
Jan
(2) |
Feb
(5) |
Mar
(7) |
Apr
(3) |
May
(8) |
Jun
(45) |
Jul
(8) |
Aug
|
Sep
(2) |
Oct
(14) |
Nov
(7) |
Dec
(2) |
| 2024 |
Jan
(4) |
Feb
(4) |
Mar
|
Apr
(7) |
May
(2) |
Jun
(1) |
Jul
|
Aug
(5) |
Sep
|
Oct
|
Nov
(4) |
Dec
(14) |
| 2025 |
Jan
(22) |
Feb
(6) |
Mar
(5) |
Apr
(14) |
May
(6) |
Jun
(11) |
Jul
(19) |
Aug
|
Sep
(17) |
Oct
(1) |
Nov
(2) |
Dec
(18) |
| 2026 |
Jan
|
Feb
|
Mar
(5) |
Apr
|
May
(2) |
Jun
(1) |
Jul
(6) |
Aug
(1) |
Sep
|
Oct
|
Nov
|
Dec
|
|
From: Ethan A M. <sf...@us...> - 2015-03-30 21:43:02
|
On Monday, 30 March, 2015 21:21:04 pl...@pi... wrote: > On 03/30/15 17:38, sfeam wrote: > > On Monday, 30 March 2015 03:48:41 PM Tatsuro MATSUOKA wrote: > > > >> The same phenomenon occurs on gnuplot on Ubuntu 14.04 LTS. > >> gnuplot> set terminal postscript lw 1.5; set output 'ps_symbols.ps' > >> Terminal type set to 'postscript' > >> Options are 'landscape enhanced defaultplex \ > >> leveldefault monochrome colortext \ > >> dashlength 1.0 linewidth 1.5 butt noclip \ > >> nobackground \ > >> palfuncparam 2000,0.003 \ > >> "Helvetica" 14 fontscale 1.0 ' > >> ^ > >> unrecognized option > >> > >> gnuplot> > >> > >> The above seem to be platform independent. > >> > >> Tatsuro > > > > Sorry for the error. It is fixed now. > > > > This is an example of a tyoe of programming error (failure to > > check for end of command line) that is not exercised or caught > > by running "make check". Does anyone have suggestions about > > how to add more stringent tests for debugging program changes? > > > > Ethan > > > > 'unrecognized option' suggests it was still parsing when,indeedn, it > should have been. Where is the end of line that it failed to find? > > I don't see what you are hoping to catch, or what the root cause of > this bug was. The error was that it incremented the current token index, c_token, past the semicolor. Parsing is obviously supposed to stop and restart after the semicolor, but the check has to be made explicitly using if (END_OF_COMMAND) ... In this case I forget to add that check, so the parser tried to interpret the subsequent "set output ..." as if it were part of the previous command. A while back I caught a dozen or so examples of this same error by manually editing the demo collection to add " ; junk_command=0 " at the end of every line of each demo. That had the effect of testing whether the implementation of every command used by the demos correctly checked for end of command and therefore did not over-run the semicolon. I guess what I'd like is a more generalized "command fuzzer", to test whether incorrect input is correctly caught and reported rather than triggering a segfault or other unpleasant behaviour. Ethan |
|
From: <pl...@pi...> - 2015-03-30 20:36:01
|
On 03/30/15 17:38, sfeam wrote: > On Monday, 30 March 2015 03:48:41 PM Tatsuro MATSUOKA wrote: > >> The same phenomenon occurs on gnuplot on Ubuntu 14.04 LTS. >> gnuplot> set terminal postscript lw 1.5; set output 'ps_symbols.ps' >> Terminal type set to 'postscript' >> Options are 'landscape enhanced defaultplex \ >> leveldefault monochrome colortext \ >> dashlength 1.0 linewidth 1.5 butt noclip \ >> nobackground \ >> palfuncparam 2000,0.003 \ >> "Helvetica" 14 fontscale 1.0 ' >> ^ >> unrecognized option >> >> gnuplot> >> >> The above seem to be platform independent. >> >> Tatsuro > > Sorry for the error. It is fixed now. > > This is an example of a tyoe of programming error (failure to > check for end of command line) that is not exercised or caught > by running "make check". Does anyone have suggestions about > how to add more stringent tests for debugging program changes? > > Ethan > 'unrecognized option' suggests it was still parsing when,indeedn, it should have been. Where is the end of line that it failed to find? I don't see what you are hoping to catch, or what the root cause of this bug was. Peter. |
|
From: sfeam <sf...@us...> - 2015-03-30 15:40:12
|
On Monday, 30 March 2015 03:48:41 PM Tatsuro MATSUOKA wrote: > The same phenomenon occurs on gnuplot on Ubuntu 14.04 LTS. > gnuplot> set terminal postscript lw 1.5; set output 'ps_symbols.ps' > Terminal type set to 'postscript' > Options are 'landscape enhanced defaultplex \ > leveldefault monochrome colortext \ > dashlength 1.0 linewidth 1.5 butt noclip \ > nobackground \ > palfuncparam 2000,0.003 \ > "Helvetica" 14 fontscale 1.0 ' > ^ > unrecognized option > > gnuplot> > > The above seem to be platform independent. > > Tatsuro Sorry for the error. It is fixed now. This is an example of a tyoe of programming error (failure to check for end of command line) that is not exercised or caught by running "make check". Does anyone have suggestions about how to add more stringent tests for debugging program changes? Ethan |
|
From: Tatsuro M. <tma...@ya...> - 2015-03-30 06:48:51
|
> From: Tatsuro MATSUOKA > To: tma...@ya...; gnuplot-beta > Cc: > Date: 2015/3/30, Mon 15:30 > Subject: Re: "ps_symbols.gpi", line 2: unrecognized option during make ps_symbols.ps > > >> From: Tatsuro MATSUOKA >> To: gnuplot-beta >> Cc: >> Date: 2015/3/30, Mon 13:37 >> Subject: "ps_symbols.gpi", line 2: unrecognized option during > make ps_symbols.ps >> >> Hello >> >> I have checked out the latest cvs snapshot of gnuplot (ChageLog > 2015-03-29) >> >> In windows build (make all), >> >> >> GNUPLOT_LIB=../../docs/psdoc GNUPLOT_PS_DIR=../../term/PostScript > gnuplot.exe >> ps_symbols.gpi >> >> set terminal postscript lw 1.5; set output 'ps_symbols.ps' >> ^ >> "ps_symbols.gpi", line 2: unrecognized option >> >> Makefile:789: recipe for target 'ps_symbols.pdf' failed >> make[1]: *** [ps_symbols.pdf] Error 1 >> make[1]: Leaving directory >> > '/e/usr/Tatsu/mingw32work_490/gnuplot/gnuplotcvs/gnuplot/config/mingw' >> Makefile:465: recipe for target 'docs' failed >> make: *** [docs] Error 2 >> >> >> set terminal postscript lw 1.5; set output 'ps_symbols.ps' >> ^ >> "ps_symbols.gpi", line 2: unrecognized option >> >> I do not understand why the line 2 gives error. >> >> I have never experienced such an error during "make all" >> What is happening? >> >> Regards >> >> Tatsuro >> > From gnuplot prompt; > > Version 5.1 patchlevel 0 last modified 2015-03-29 > > > gnuplot> set terminal postscript lw 1.5; set output 'ps_symbols.ps' > Terminal type set to 'postscript' > Options are 'landscape enhanced defaultplex \ > leveldefault monochrome colortext \ > dashlength 1.0 linewidth 1.5 butt noclip \ > nobackground \ > palfuncparam 2000,0.003 \ > "Helvetica" 14 fontscale 1.0 ' > ^ > unrecognized option > ???? > > Of course > > gnuplot> set terminal postscript lw 1.5 > gnuplot> set output 'ps_symbols.ps' > > > is OK. > > What happens in the latest change? > > Tasturo The same phenomenon occurs on gnuplot on Ubuntu 14.04 LTS. gnuplot> set terminal postscript lw 1.5; set output 'ps_symbols.ps' Terminal type set to 'postscript' Options are 'landscape enhanced defaultplex \ leveldefault monochrome colortext \ dashlength 1.0 linewidth 1.5 butt noclip \ nobackground \ palfuncparam 2000,0.003 \ "Helvetica" 14 fontscale 1.0 ' ^ unrecognized option gnuplot> The above seem to be platform independent. Tatsuro |
|
From: Tatsuro M. <tma...@ya...> - 2015-03-30 06:30:19
|
----- Original Message ----- > From: Tatsuro MATSUOKA > To: gnuplot-beta > Cc: > Date: 2015/3/30, Mon 13:37 > Subject: "ps_symbols.gpi", line 2: unrecognized option during make ps_symbols.ps > > Hello > > I have checked out the latest cvs snapshot of gnuplot (ChageLog 2015-03-29) > > In windows build (make all), > > > GNUPLOT_LIB=../../docs/psdoc GNUPLOT_PS_DIR=../../term/PostScript gnuplot.exe > ps_symbols.gpi > > set terminal postscript lw 1.5; set output 'ps_symbols.ps' > ^ > "ps_symbols.gpi", line 2: unrecognized option > > Makefile:789: recipe for target 'ps_symbols.pdf' failed > make[1]: *** [ps_symbols.pdf] Error 1 > make[1]: Leaving directory > '/e/usr/Tatsu/mingw32work_490/gnuplot/gnuplotcvs/gnuplot/config/mingw' > Makefile:465: recipe for target 'docs' failed > make: *** [docs] Error 2 > > > set terminal postscript lw 1.5; set output 'ps_symbols.ps' > ^ > "ps_symbols.gpi", line 2: unrecognized option > > I do not understand why the line 2 gives error. > > I have never experienced such an error during "make all" > What is happening? > > Regards > > Tatsuro > From gnuplot prompt; Version 5.1 patchlevel 0 last modified 2015-03-29 gnuplot> set terminal postscript lw 1.5; set output 'ps_symbols.ps' Terminal type set to 'postscript' Options are 'landscape enhanced defaultplex \ leveldefault monochrome colortext \ dashlength 1.0 linewidth 1.5 butt noclip \ nobackground \ palfuncparam 2000,0.003 \ "Helvetica" 14 fontscale 1.0 ' ^ unrecognized option ???? Of course gnuplot> set terminal postscript lw 1.5 gnuplot> set output 'ps_symbols.ps' is OK. What happens in the latest change? Tasturo |
|
From: Tatsuro M. <tma...@ya...> - 2015-03-30 04:37:47
|
Hello I have checked out the latest cvs snapshot of gnuplot (ChageLog 2015-03-29) In windows build (make all), GNUPLOT_LIB=../../docs/psdoc GNUPLOT_PS_DIR=../../term/PostScript gnuplot.exe ps_symbols.gpi set terminal postscript lw 1.5; set output 'ps_symbols.ps' ^ "ps_symbols.gpi", line 2: unrecognized option Makefile:789: recipe for target 'ps_symbols.pdf' failed make[1]: *** [ps_symbols.pdf] Error 1 make[1]: Leaving directory '/e/usr/Tatsu/mingw32work_490/gnuplot/gnuplotcvs/gnuplot/config/mingw' Makefile:465: recipe for target 'docs' failed make: *** [docs] Error 2 set terminal postscript lw 1.5; set output 'ps_symbols.ps' ^ "ps_symbols.gpi", line 2: unrecognized option I do not understand why the line 2 gives error. I have never experienced such an error during "make all" What is happening? Regards Tatsuro |
|
From: Philipp K. J. <ja...@ie...> - 2015-03-30 00:40:52
|
On Sun, 29 Mar 2015 14:21:55 -0700 sfeam <sf...@us...> wrote: > On Thursday, 26 March 2015 03:53:22 PM Philipp K. Janert wrote: > > > > I was wondering: how is "fontscale" to be used? > > > > Is the primary idea that I can change the font > > size, even without knowing what it actually is? > > The primary use that I see is rescaling a previously composed > figure for a new use. Suppose you originally composed a > figure for screen display, with appropriate font sizes, > line widths, dash lengths, and so on. Now you want to use > it for publication, but typically a publisher requests figures > to be suitable for printing at 300 dpi. This is roughly > three times a typical workstation screen display resolution. I see. Makes sense. Thanks for the clarification. > > If you just change the requested size of the figure by a > factor of 3, then all the lines will be too thin, the fonts > will be too small, and dashed lines will become less distinguishable. > The fix is to keep the same commands that generated your > original plot but scale up those properties to match the > scale-up of the canvas size. > > E.g. > > # Display figure on the screen > set term png size 700, 500 > set output '|display png:-' > load "Figure.gp" > pause -1 > > # Now rescale the same figure for publication > set term png size 2100, 1500 fontscale 3 lw 3 dl 3 > set output 'Figure.png' > load "Figure.gp" > > NB: In gnuplot 5 dashlength scales with linewidth already, > so the "dl 3" part is not required. But that was not > true in gnuplot 4. > > > Ethan > > > > > > > Best, > > > > Ph. > |
|
From: Philipp K. J. <ja...@ie...> - 2015-03-30 00:39:04
|
On Mon, 30 Mar 2015 00:52:19 +0200 Hans-Bernhard Bröker <HBB...@t-...> wrote: > [Ooops, forgot to CC the list] > > Am 26.03.2015 um 22:39 schrieb Philipp K. Janert: > > > I just tried to build cvs-tip (5.1) from source and > > encountered the following issue: > > > > The only Lua packages I had installed were the lua > > libraries (liblua, incl dev versions). This was > > enough to build 5.0, including the Lua terminal. > > It shouldn't have been. But back then there was still a pre-built > version of gnuplot-lua-tikz.sty in the repository, but that's a > violation of the general "no generated files go into revision control" > policy. Thanks for the reply. > > Nor does it, IMHO, make terribly much sense for your distro to allow > installing liblua and liblua-dev without having the lua core package, > too. Agree, I was surprised by that, too. > ./configure --without-lua might have been the cleaner way out. > > > The relevant portions of the ./configure output are: > > (Relevant portions of) config.log would offer more insight. Didn't know about that one. > > > Should ./configure have detected the missing lua > > interpreter? > > It did. That's the "no" result in the first check. But that didn't > keep the build from trying to use it. That's a bug in configure.ac. > Ok. > > > > ------------------------------------------------------------------------------ > Dive into the World of Parallel Programming The Go Parallel Website, > sponsored by Intel and developed in partnership with Slashdot Media, > is your hub for all things parallel software development, from weekly > thought leadership blogs to news, videos, case studies, tutorials and > more. Take a look and join the conversation now. > http://goparallel.sourceforge.net/ > _______________________________________________ gnuplot-beta mailing > list gnu...@li... > Membership management via: > https://lists.sourceforge.net/lists/listinfo/gnuplot-beta |
|
From: Hans-Bernhard B. <HBB...@t-...> - 2015-03-29 22:52:35
|
[Ooops, forgot to CC the list] Am 26.03.2015 um 22:39 schrieb Philipp K. Janert: > I just tried to build cvs-tip (5.1) from source and > encountered the following issue: > > The only Lua packages I had installed were the lua > libraries (liblua, incl dev versions). This was > enough to build 5.0, including the Lua terminal. It shouldn't have been. But back then there was still a pre-built version of gnuplot-lua-tikz.sty in the repository, but that's a violation of the general "no generated files go into revision control" policy. Nor does it, IMHO, make terribly much sense for your distro to allow installing liblua and liblua-dev without having the lua core package, too. ./configure --without-lua might have been the cleaner way out. > The relevant portions of the ./configure output are: (Relevant portions of) config.log would offer more insight. > Should ./configure have detected the missing lua > interpreter? It did. That's the "no" result in the first check. But that didn't keep the build from trying to use it. That's a bug in configure.ac. |
|
From: sfeam <sf...@us...> - 2015-03-29 21:24:12
|
On Thursday, 26 March 2015 03:53:22 PM Philipp K. Janert wrote:
>
> I was wondering: how is "fontscale" to be used?
>
> Is the primary idea that I can change the font
> size, even without knowing what it actually is?

The primary use that I see is rescaling a previously composed
figure for a new use.  Suppose you originally composed a
figure for screen display, with appropriate font sizes,
line widths, dash lengths, and so on.   Now you want to use
it for publication, but typically a publisher requests figures
to be suitable for printing at 300 dpi.  This is roughly
three times a typical workstation screen display resolution.

If you just change the requested size of the figure by a
factor of 3, then all the lines will be too thin, the fonts
will be too small, and dashed lines will become less distinguishable.
The fix is to keep the same commands that generated your
original plot but scale up those properties to match the
scale-up of the canvas size.

E.g.

  # Display figure on the screen
  set term png size 700, 500
  set output '|display png:-'
  load "Figure.gp"
  pause -1

  # Now rescale the same figure for publication
  set term png size 2100, 1500 fontscale 3 lw 3 dl 3
  set output 'Figure.png'
  load "Figure.gp"

NB: In gnuplot 5 dashlength scales with linewidth already,
    so the "dl 3" part is not required.  But that was not
    true in gnuplot 4.


	Ethan


>
> Best,
>
> 		Ph.
|
|
From: sfeam <sf...@us...> - 2015-03-29 21:16:10
|
On Sunday, 29 March 2015 11:07:24 PM Petr Mikulik wrote:
> I see the latest changeset:
>
> +       New commands
> +               [un}set monochrome {linetype N <line-properties>}
> +               set color     (same as "unset mono")
> +
> +       "set color".  Terminal types that used to provide a separate "mono"
> +       keyword now trigger "set mono" as appropriate.  For example,
> +       "set term pdf mono" is equivalent to "set term pdf; set mono".
> +       Six default monochrome linetypes are pre-defined. These do not exactly
> +       duplicate the idiosynchratic mono linetypes of various pre-version 5
> +       terminals (be cairo cgm emf fig pdf post ...).  Some further
>
> I would expect the command to be
>  	set termoption {mono | color}

"set termoption" would only work if the current terminal supported
"mono" as a terminal-specific feature.  "set mono" works for all
terminals regardless of whether or not they ever supported a "mono"
keyword in earlier gnuplot versions.

And even for those terminals that [used to] have a "mono" keyword
option, triggering it via "set termoption" would not work in version 5
because the whole system of dot/dash support was fundamentally revised.
The fact that "set term foo mono" wasn't working is exactly what people
have been complaining about, and is the primary reason for the new
approach.  I had not anticipated this would be such a big deal, but
apparently it is.

	Ethan


>
> as there are already:
>
>        set termoption {no}enhanced
>        set termoption font "<fontname>{,<fontsize>}"
>        set termoption fontscale <scale>
>        set termoption {solid|dashed}
>        set termoption {linewidth <lw>}{lw <lw>}
>
> Is there any reason for such an inconsistent command (populating the main
> "set" space)?
> I would definitely vote for the "set termopt ..." variant.
>
> ---
> PM
>
> ------------------------------------------------------------------------------
> Dive into the World of Parallel Programming The Go Parallel Website, sponsored
> by Intel and developed in partnership with Slashdot Media, is your hub for all
> things parallel software development, from weekly thought leadership blogs to
> news, videos, case studies, tutorials and more. Take a look and join the
> conversation now. http://goparallel.sourceforge.net/
> _______________________________________________
> gnuplot-beta mailing list
> gnu...@li...
> Membership management via: https://lists.sourceforge.net/lists/listinfo/gnuplot-beta
|
|
From: Petr M. <mi...@ph...> - 2015-03-29 21:07:35
|
I see the latest changeset:

+       New commands
+               [un}set monochrome {linetype N <line-properties>}
+               set color     (same as "unset mono")
+
+       "set color".  Terminal types that used to provide a separate "mono"
+       keyword now trigger "set mono" as appropriate.  For example,
+       "set term pdf mono" is equivalent to "set term pdf; set mono".
+       Six default monochrome linetypes are pre-defined. These do not exactly
+       duplicate the idiosynchratic mono linetypes of various pre-version 5
+       terminals (be cairo cgm emf fig pdf post ...).  Some further

I would expect the command to be
 	set termoption {mono | color}

as there are already:

       set termoption {no}enhanced
       set termoption font "<fontname>{,<fontsize>}"
       set termoption fontscale <scale>
       set termoption {solid|dashed}
       set termoption {linewidth <lw>}{lw <lw>}

Is there any reason for such an inconsistent command (populating the main
"set" space)?
I would definitely vote for the "set termopt ..." variant.

---
PM
|
|
From: Philipp K. J. <ja...@ie...> - 2015-03-26 22:53:29
|
I was wondering: how is "fontscale" to be used? Is the primary idea that I can change the font size, even without knowing what it actually is? Best, Ph. |
|
From: Philipp K. J. <ja...@ie...> - 2015-03-26 21:39:15
|
I just tried to build cvs-tip (5.1) from source and encountered the following issue: The only Lua packages I had installed were the lua libraries (liblua, incl dev versions). This was enough to build 5.0, including the Lua terminal. When trying to build 5.1, ./configure seemed to be happy, but make ended with an error: Making all in LaTeX make[3]: Entering directory `/home/janert/Sandbox-Gnuplot5/cvs-new/gnuplot/share/LaTeX' test -z "BUILD_LUA" || lua ../../term/lua/gnuplot-tikz.lua style /bin/bash: lua: command not found make[3]: *** [gnuplot-lua-tikz.sty] Error 127 make[3]: Leaving directory `/home/janert/Sandbox-Gnuplot5/cvs-new/gnuplot/share/LaTeX' make[2]: *** [all-recursive] Error 1 make[2]: Leaving directory `/home/janert/Sandbox-Gnuplot5/cvs-new/gnuplot/share' make[1]: *** all-recursive] Error 1 make[1]: Leaving directory `/home/janert/Sandbox-Gnuplot5/cvs-new/gnuplot' make: *** [all] Error 2 The relevant portions of the ./configure output are: checking for LUA... no checking for LUA... yes checking lua.h usability... yes checking lua.h presence... yes checking for lua.h... yes I then installed lua (the interpreter itself), and now the build succeeds. Should ./configure have detected the missing lua interpreter? Best, Ph. |
|
From: sfeam <sf...@us...> - 2015-03-25 15:28:10
|
On Wednesday, 25 March 2015 11:02:11 AM pl...@pi... wrote: > Hi, > > I came across this SVG on WikiPedia and tried to scale up but it would > not budge. > > http://upload.wikimedia.org/wikipedia/commons/e/e5/Window_function_and_frequency_response_-_Cosine.svg > > I had a look at the document source and found that it was created by > gnuplot 4.6 patch level 0. That is ostensibly the same as I use on my > embedded system and it produces SVG that do scale perfectly. > > I do notice that the group "gnuplot_canvas" on mine in inside a rect , > while thier non-scaling one it's the other way around, the rect is the > outermost element. > > <!-- Tie mousing to entire bounding box of the plot --> > <rect x="0" y="0" width="600" height="480" fill="#ffffff" stroke="black" > stroke-width="1" > onclick="gnuplot_svg.toggleCoordBox(evt)" > onmousemove="gnuplot_svg.moveCoordBox(evt)"/> > > <!-- Also track mouse when it is on a plot element --> > <g id="gnuplot_canvas" onclick="gnuplot_svg.toggleCoordBox(evt)" > onmousemove="gnuplot_svg.moveCoordBox(evt)"> > > > > <g id="gnuplot_canvas"> > <rect x="0" y="0" width="576" height="288" fill="none"/> > > > Now I can't understand why the WP graph is not scalable, indeed what is > the point of scalable vector graphic that will not scale. > > Am I missing something? When you select the svg terminal in gnuplot, you have the option of adding a keyword "fixed" or "dynamic", as in set term svg size 576, 288 fixed The primary use for this that I know of is to control what happens if you display the svg graph inside an HTML element that is itself of a fixed size. In one case a browser will typically show only a window into the svg graph and will provide slider bars to move the window; in the other case it will typically scale the graph to fit in the HTML element. Both cases are controlled by the browser and thus may vary across platforms, versions, and perhaps the phase of the moon. This is particularly true if, as in the URL you gave, the svg plot is not embedded in an HTML element. If you view that same svg plot via the Wikipedia page in which it is embedded http://en.wikipedia.org/wiki/Window_function I think you will find that it does scale with the rest of the page. IIRC this is also relevant to embedding svg elements inside each other, but I don't have an example to give. Ethan |
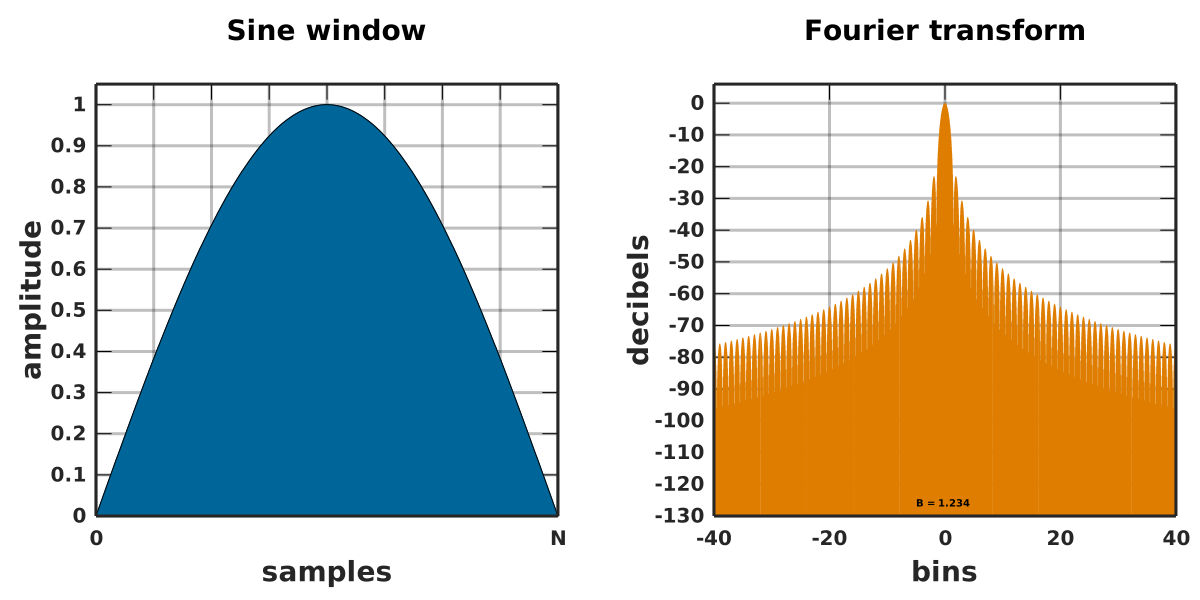
|
From: <pl...@pi...> - 2015-03-25 12:28:36
|
Hi, I came across this SVG on WikiPedia and tried to scale up but it would not budge. http://upload.wikimedia.org/wikipedia/commons/e/e5/Window_function_and_frequency_response_-_Cosine.svg I had a look at the document source and found that it was created by gnuplot 4.6 patch level 0. That is ostensibly the same as I use on my embedded system and it produces SVG that do scale perfectly. I do notice that the group "gnuplot_canvas" on mine in inside a rect , while thier non-scaling one it's the other way around, the rect is the outermost element. <!-- Tie mousing to entire bounding box of the plot --> <rect x="0" y="0" width="600" height="480" fill="#ffffff" stroke="black" stroke-width="1" onclick="gnuplot_svg.toggleCoordBox(evt)" onmousemove="gnuplot_svg.moveCoordBox(evt)"/> <!-- Also track mouse when it is on a plot element --> <g id="gnuplot_canvas" onclick="gnuplot_svg.toggleCoordBox(evt)" onmousemove="gnuplot_svg.moveCoordBox(evt)"> <g id="gnuplot_canvas"> <rect x="0" y="0" width="576" height="288" fill="none"/> Now I can't understand why the WP graph is not scalable, indeed what is the point of scalable vector graphic that will not scale. Am I missing something? Regards, Peter. |
|
From: Tatsuro M. <tma...@ya...> - 2015-03-24 18:48:01
|
--- Ethan A Merriつ> On Tuesday, 24 March, 2015 09:40:04 Tatsuro MATSUOKA wrote: > > Hello > > I have opened two ticket items. > > pause -1 message is not correct for gnuplot.exe built by MinGW > > http://sourceforge.net/p/gnuplot/bugs/1580/ > I've applied this one. > Thanks! > > Improve utf-8 treatment in interactive session on gnuplot for windows > > http://sourceforge.net/p/gnuplot/feature-requests/415/ > But I'd rather leave this for Bastian or someone else who can confirm the compilation on Windows. Ethan > OK. I hope that Bastian or someone else comfirm the Shigeharu's patch in the near future. Tatsuro > |
|
From: Ethan A M. <sf...@us...> - 2015-03-24 16:48:16
|
On Tuesday, 24 March, 2015 09:40:04 Tatsuro MATSUOKA wrote: > Hello > > I have opened two ticket items. > > pause -1 message is not correct for gnuplot.exe built by MinGW > > http://sourceforge.net/p/gnuplot/bugs/1580/ I've applied this one. > Improve utf-8 treatment in interactive session on gnuplot for windows > > http://sourceforge.net/p/gnuplot/feature-requests/415/ But I'd rather leave this for Bastian or someone else who can confirm the compilation on Windows. Ethan |
|
From: Tatsuro M. <tma...@ya...> - 2015-03-24 15:11:16
|
----- Original Message ----- > From: Ethan A Merritt > Cc: gnu...@li...; bma...@we... > Date: 2015/3/24, Tue 12:52 > Subject: Re: Please commit my post to the tickets (bug #1580, Feature Requests #415) > > On Tuesday, 24 March 2015 09:40:04 AM Tatsuro MATSUOKA wrote: >> Hello >> >> I have opened two ticket items. >> >> Improve utf-8 treatment in interactive session on gnuplot for windows >> >> http://sourceforge.net/p/gnuplot/feature-requests/415/ >> >> >> pause -1 message is not correct for gnuplot.exe built by MinGW >> >> http://sourceforge.net/p/gnuplot/bugs/1580/ >> >> >> If you have time I am happy for the commit the above. > > Are you sure that this patch is OK? > It always prings an extra "\n" because the commands following > "if (buf)" are not inside { } brackets. > > Was that intended? > > %%%%% > --- a/src/command.c 2015-02-16 01:39:20.000000000 +0900 > +++ b/src/command.c 2015-03-23 13:18:41.546081300 +0900 > @@ -1465,7 +1465,8 @@ > # if defined(WGP_CONSOLE) && defined(USE_MOUSE) > if (!paused_for_mouse || !MousableWindowOpened()) { > int junk = 0; > - if (buf) fprintf(stderr, "%s\n", buf); > + /* Use fputs instead of fprintf("%s\n",buf) to avoid > error in Message of Japanese Characters > in MinGW Compiler*/ > + if (buf) fputs(buf, stderr);fputs("\n", stderr); > /* cannot use EAT_INPUT_WITH here */ > do { > junk = getch(); > %%%%% > > Ethan I have forgotten to CC. to the list. What you say is indeed right. > + if (buf) fputs(buf, stderr);fputs("\n", stderr); is not correct. > + if (buf) { fputs(buf, stderr);fputs("\n", stderr);} is correct Regards Tatsuro |
|
From: Ethan A M. <eam...@gm...> - 2015-03-24 03:52:18
|
On Tuesday, 24 March 2015 09:40:04 AM Tatsuro MATSUOKA wrote: > Hello > > I have opened two ticket items. > > Improve utf-8 treatment in interactive session on gnuplot for windows > > http://sourceforge.net/p/gnuplot/feature-requests/415/ > > > pause -1 message is not correct for gnuplot.exe built by MinGW > > http://sourceforge.net/p/gnuplot/bugs/1580/ > > > If you have time I am happy for the commit the above. Are you sure that this patch is OK? It always prings an extra "\n" because the commands following "if (buf)" are not inside { } brackets. Was that intended? %%%%% --- a/src/command.c 2015-02-16 01:39:20.000000000 +0900 +++ b/src/command.c 2015-03-23 13:18:41.546081300 +0900 @@ -1465,7 +1465,8 @@ # if defined(WGP_CONSOLE) && defined(USE_MOUSE) if (!paused_for_mouse || !MousableWindowOpened()) { int junk = 0; - if (buf) fprintf(stderr, "%s\n", buf); + /* Use fputs instead of fprintf("%s\n",buf) to avoid error in Message of Japanese Characters in MinGW Compiler*/ + if (buf) fputs(buf, stderr);fputs("\n", stderr); /* cannot use EAT_INPUT_WITH here */ do { junk = getch(); %%%%% Ethan |
|
From: Tatsuro M. <tma...@ya...> - 2015-03-24 00:40:12
|
Hello I have opened two ticket items. Improve utf-8 treatment in interactive session on gnuplot for windows http://sourceforge.net/p/gnuplot/feature-requests/415/ pause -1 message is not correct for gnuplot.exe built by MinGW http://sourceforge.net/p/gnuplot/bugs/1580/ If you have time I am happy for the commit the above. Regards Tatsurp |
|
From: Tatsuro M. <tma...@ya...> - 2015-03-21 09:06:14
|
Hello This is just a ping. I have created the ticket for feature request: #415 Improve utf-8 treatment in interactive session on gnuplot for windows https://sourceforge.net/p/gnuplot/feature-requests/415/ Shigeharu Takeno proposed the patch for my request. If you are interested in the patch, please discuss in the ticket. Regards Tatsuro |
|
From: sfeam <sf...@us...> - 2015-03-15 16:40:09
|
On Sunday, 15 March 2015 02:54:48 PM pl...@pi... wrote: > Hi, > > I seem to have an oddity in putting a conditional in the using clause in > v5.0 > > > tail longest.dat > > 171 3342.447 > 172 3371.391 > 173 3400.336 > 174 3465.342 > 175 3458.227 > 176 3324.896 > 177 3389.902 > 178 3400.818 > 179 3429.764 > 180 3476.738 > > > G N U P L O T > Version 5.0 patchlevel alpha last modified 2014-05-10 > > > > > gnuplot> plot "longest.dat" using (($1/2*2==$1)?NaN:$1):2 > > x range is invalid > > > I'm trying to plot for the even values in col 1. > if I do : using (($1/2*2==$1)?$1:NaN):2 it plots every point > and using (($1/2*2==$1)?NaN:$1):2 complains that it has an empty x > range ( ie using is always returning NaN. That is because $1/2*2 always equals $1. You are probably thinking that your column 1 values are integers and therefore $1/2 will be truncated to an integer also, but that is not the case. Data values are always read in as (double). Try plot "longest.dat" using ((int($1)/2*2==$1)?NaN:$1):2 or maybe plot "longest.dat" using ((int($1)&01 == 01) ? $1 : NaN):2 > > The syntax of my using clause seem right if I test it in a print: > > gnuplot> i=179;print (i/2*2==i)?i:NaN > NaN > gnuplot> i=178;print (i/2*2==i)?i:NaN > 178 > > I know I could do this using "every" with that sample data but this is > about the syntax not giving expected result. > > Peter. |
|
From: <pl...@pi...> - 2015-03-15 15:49:46
|
Hi,

I seem to have an oddity in putting a conditional in the using clause in
v5.0


  tail longest.dat

171  3342.447
172  3371.391
173  3400.336
174  3465.342
175  3458.227
176  3324.896
177  3389.902
178  3400.818
179  3429.764
180  3476.738


G N U P L O T
         Version 5.0 patchlevel alpha    last modified 2014-05-10


gnuplot>  plot  "longest.dat" using (($1/2*2==$1)?NaN:$1):2

          x range is invalid


I'm trying to plot for the even  values in col 1.
if I do :  using (($1/2*2==$1)?$1:NaN):2   it plots every point
and  using (($1/2*2==$1)?NaN:$1):2 complains that it has an empty x
range ( ie using is always returning NaN.

The syntax of my using clause seem right if I test it in a print:

gnuplot>   i=179;print (i/2*2==i)?i:NaN
NaN
gnuplot>   i=178;print (i/2*2==i)?i:NaN
178

I know I could do this using "every" with that sample data but this is
about the syntax not giving expected result.

Peter.
|
|
From: Philipp K. J. <ja...@ie...> - 2015-03-08 14:22:17
|
I am cross-posting this from gnuplot-info. The documentation is really not very clear. Can somebody help clarify? Best, Ph. I am having difficulties understanding the precise meaning of the "error" facility within the fit command. Can someone clarify? 1) The documentation mentions three "keywords": zerror yerror error z Are they synonyms? Or are there semantic differences? Is "error z" a fixed phrase, or is it also possible to have "error x" or something like that? 2) In the demos I found an example using "xyerror", which is not mentioned in the docs. What does that do? How does weighting the x-values enter into the calculation of the error (=SSR)? 3) What does the presence of zerror actually tell me (or gnuplot)? Is it correct to say that WITH "zerror" the last entry in the "using" spec is interpreted as the error column, whereas with "noerror", the last column is interpreted as the "y-value", and errors (=weights) are set equal to 1? Are there exceptions to this rule? |
28 messages has been excluded from this view by a project administrator.

