
Menu
▾
▴
gnuplot-beta — Developers and beta testers of new gnuplot code
You can subscribe to this list here.
| 2001 |
Jan
|
Feb
(1) |
Mar
|
Apr
|
May
|
Jun
|
Jul
(1) |
Aug
|
Sep
|
Oct
|
Nov
|
Dec
|
|---|---|---|---|---|---|---|---|---|---|---|---|---|
| 2002 |
Jan
(1) |
Feb
|
Mar
|
Apr
|
May
|
Jun
|
Jul
(1) |
Aug
(1) |
Sep
|
Oct
|
Nov
(1) |
Dec
|
| 2003 |
Jan
|
Feb
|
Mar
|
Apr
|
May
|
Jun
|
Jul
(1) |
Aug
(1) |
Sep
|
Oct
(83) |
Nov
(57) |
Dec
(111) |
| 2004 |
Jan
(38) |
Feb
(121) |
Mar
(107) |
Apr
(241) |
May
(102) |
Jun
(190) |
Jul
(239) |
Aug
(158) |
Sep
(184) |
Oct
(193) |
Nov
(47) |
Dec
(68) |
| 2005 |
Jan
(190) |
Feb
(105) |
Mar
(99) |
Apr
(65) |
May
(92) |
Jun
(250) |
Jul
(197) |
Aug
(128) |
Sep
(101) |
Oct
(183) |
Nov
(186) |
Dec
(42) |
| 2006 |
Jan
(102) |
Feb
(122) |
Mar
(154) |
Apr
(196) |
May
(181) |
Jun
(281) |
Jul
(310) |
Aug
(198) |
Sep
(145) |
Oct
(188) |
Nov
(134) |
Dec
(90) |
| 2007 |
Jan
(134) |
Feb
(181) |
Mar
(157) |
Apr
(57) |
May
(81) |
Jun
(204) |
Jul
(60) |
Aug
(37) |
Sep
(17) |
Oct
(90) |
Nov
(122) |
Dec
(72) |
| 2008 |
Jan
(130) |
Feb
(108) |
Mar
(160) |
Apr
(38) |
May
(83) |
Jun
(42) |
Jul
(75) |
Aug
(16) |
Sep
(71) |
Oct
(57) |
Nov
(59) |
Dec
(152) |
| 2009 |
Jan
(73) |
Feb
(213) |
Mar
(67) |
Apr
(40) |
May
(46) |
Jun
(82) |
Jul
(73) |
Aug
(57) |
Sep
(108) |
Oct
(36) |
Nov
(153) |
Dec
(77) |
| 2010 |
Jan
(42) |
Feb
(171) |
Mar
(150) |
Apr
(6) |
May
(22) |
Jun
(34) |
Jul
(31) |
Aug
(38) |
Sep
(32) |
Oct
(59) |
Nov
(13) |
Dec
(62) |
| 2011 |
Jan
(114) |
Feb
(139) |
Mar
(126) |
Apr
(51) |
May
(53) |
Jun
(29) |
Jul
(41) |
Aug
(29) |
Sep
(35) |
Oct
(87) |
Nov
(42) |
Dec
(20) |
| 2012 |
Jan
(111) |
Feb
(66) |
Mar
(35) |
Apr
(59) |
May
(71) |
Jun
(32) |
Jul
(11) |
Aug
(48) |
Sep
(60) |
Oct
(87) |
Nov
(16) |
Dec
(38) |
| 2013 |
Jan
(5) |
Feb
(19) |
Mar
(41) |
Apr
(47) |
May
(14) |
Jun
(32) |
Jul
(18) |
Aug
(68) |
Sep
(9) |
Oct
(42) |
Nov
(12) |
Dec
(10) |
| 2014 |
Jan
(14) |
Feb
(139) |
Mar
(137) |
Apr
(66) |
May
(72) |
Jun
(142) |
Jul
(70) |
Aug
(31) |
Sep
(39) |
Oct
(98) |
Nov
(133) |
Dec
(44) |
| 2015 |
Jan
(70) |
Feb
(27) |
Mar
(36) |
Apr
(11) |
May
(15) |
Jun
(70) |
Jul
(30) |
Aug
(63) |
Sep
(18) |
Oct
(15) |
Nov
(42) |
Dec
(29) |
| 2016 |
Jan
(37) |
Feb
(48) |
Mar
(59) |
Apr
(28) |
May
(30) |
Jun
(43) |
Jul
(47) |
Aug
(14) |
Sep
(21) |
Oct
(26) |
Nov
(10) |
Dec
(2) |
| 2017 |
Jan
(26) |
Feb
(27) |
Mar
(44) |
Apr
(11) |
May
(32) |
Jun
(28) |
Jul
(75) |
Aug
(45) |
Sep
(35) |
Oct
(285) |
Nov
(99) |
Dec
(16) |
| 2018 |
Jan
(8) |
Feb
(8) |
Mar
(42) |
Apr
(35) |
May
(23) |
Jun
(12) |
Jul
(16) |
Aug
(11) |
Sep
(8) |
Oct
(16) |
Nov
(5) |
Dec
(8) |
| 2019 |
Jan
(9) |
Feb
(28) |
Mar
(4) |
Apr
(10) |
May
(7) |
Jun
(4) |
Jul
(4) |
Aug
|
Sep
(4) |
Oct
|
Nov
(23) |
Dec
(3) |
| 2020 |
Jan
(19) |
Feb
(3) |
Mar
(22) |
Apr
(17) |
May
(10) |
Jun
(69) |
Jul
(18) |
Aug
(23) |
Sep
(25) |
Oct
(11) |
Nov
(20) |
Dec
(9) |
| 2021 |
Jan
(1) |
Feb
(7) |
Mar
(9) |
Apr
|
May
(1) |
Jun
(8) |
Jul
(6) |
Aug
(8) |
Sep
(7) |
Oct
|
Nov
(2) |
Dec
(23) |
| 2022 |
Jan
(23) |
Feb
(9) |
Mar
(9) |
Apr
|
May
(8) |
Jun
(1) |
Jul
(6) |
Aug
(8) |
Sep
(30) |
Oct
(5) |
Nov
(4) |
Dec
(6) |
| 2023 |
Jan
(2) |
Feb
(5) |
Mar
(7) |
Apr
(3) |
May
(8) |
Jun
(45) |
Jul
(8) |
Aug
|
Sep
(2) |
Oct
(14) |
Nov
(7) |
Dec
(2) |
| 2024 |
Jan
(4) |
Feb
(4) |
Mar
|
Apr
(7) |
May
(2) |
Jun
(1) |
Jul
|
Aug
(5) |
Sep
|
Oct
|
Nov
(4) |
Dec
(14) |
| 2025 |
Jan
(22) |
Feb
(6) |
Mar
(5) |
Apr
(14) |
May
(6) |
Jun
(11) |
Jul
(19) |
Aug
|
Sep
(17) |
Oct
(1) |
Nov
(2) |
Dec
(18) |
| 2026 |
Jan
|
Feb
|
Mar
(5) |
Apr
|
May
(2) |
Jun
(1) |
Jul
(6) |
Aug
(1) |
Sep
|
Oct
|
Nov
|
Dec
|
|
From: Daniel J S. <dan...@ie...> - 2006-05-10 19:46:04
|
Hans-Bernhard Br=F6ker wrote:
> Now, as to the proposed prob3.dem itself.
>=20
> First off, this really should go into random.dem.  It doesn't really=20
> need yet another .dem file of its own.

I agree.  The prob.dem, prob2.dem doesn't really use the random data func=
tion.  It's more just plotting distributions and densities.  Inside rando=
m.dem would be good.

>=20
> +# demo for showing use of normal random numbers
> +
> +# Prepared by Dan Sebald
> +# History:
> +#    - 5.10.2006 ds: 1st version
>           ^^^^^^^^^
>=20
> Your calendar's off ;-)

It's always off.  :-)


>=20
> +set parametric
> +set isosamples 25,2
> +set samples 25
> +set table "temp.dat"
> +splot invnorm(rand(0)),invnorm(rand(0)),invnorm(rand(0))
> +unset table
>=20
> Looks like abuse of splot to me.  You generate 3 columns, but only use =
2=20
> below.

True, but doesn't reall hurt anything.  I used

      set samples 50
      plot invnorm(rand(0)),invnorm(rand(0))

to create just two columns.  However, when plotting with splot the follow=
ing notice appears:

      Notice: cannot contour non grid data!

It's innocuous, so big deal I guess.

How about the change to:

      splot invnorm(rand(0)),invnorm(rand(0)),-0.2

and make use of the third column by ridding the need for "using 1:2:(-0.2=
)"?

I've made that change in the attached version.

Also in the attached file is a histogram binning example for Gaussian dat=
a.  Is that one of any use?  (I think I sort of understand histeps now.) =
 It's basically a generalization of what is already inside "steps.dem".  =
Not really anything new I guess.

Dan
|
|
From:
<br...@ph...> - 2006-05-10 18:37:42
|
Now, as to the proposed prob3.dem itself.

First off, this really should go into random.dem.  It doesn't really
need yet another .dem file of its own.

+# demo for showing use of normal random numbers
+
+# Prepared by Dan Sebald
+# History:
+#	- 5.10.2006 ds: 1st version
           ^^^^^^^^^

Your calendar's off ;-)

+set parametric
+set isosamples 25,2
+set samples 25
+set table "temp.dat"
+splot invnorm(rand(0)),invnorm(rand(0)),invnorm(rand(0))
+unset table

Looks like abuse of splot to me.  You generate 3 columns, but only use 2
below.

	set samples 25
	set table 'temp.dat'
	plot invnorm(rand(0)), invnorm(rand(0))
	unset table
|
|
From:
<br...@ph...> - 2006-05-10 18:27:09
|
Daniel J Sebald wrote: > Hans-Bernhard Bröker wrote: >>> Actually, I'd think that the "linecolor", "pointtype" is an >>> extraneous syntax. Couldn't it just be "points type 7 color rgb >>> "black""? >> No, because that syntax would fail miserably in the case of 'with >> linespoints': what type does "type" address: that of the points, or >> that of the lines? > Good point. Couple things, not that it really matters too much. Is the > linespoints a special combination? It's a special combination. But you have the source, so you might take the exercise of finding that out yourself. Anyway: I seriously doubt that changing these aspects of the syntax now, 15+ years into the history of the program, is an acceptable option. > OHHHHHH! "unset clabel"!!! Having turned off the key, I guess it > wasn't that obvious that "clabel" that should be unset. This just isn't > very obvious. Feel free to suggest better wording for 'help contour', and/or a better alternative name for the option. > How about including the attached prob3.dem in the demos somewhere. It will > give an example of generating non-uniform r.v.s, (none of the > probability or random demos actually seem to do that). It will also > give an example of monochrome contour lines. It also gives an example > of using "table". Well, we have an example of 'table' already (the vectors demo goes through a table file), and 'help table' already points to the example in 'help contour', too. This example could reasonably be attached to random.dem. >>> Also see 'stat.inc'. > Gee, I didn't even know that definition file existed. But what about > the contents of that file has to do with the invnorm() function or > generating r.v.s? Nothing in particular. Just thought you should consider it before reinventing more wheels; and it does deal with normal distributions at least a bit. |
|
From: Ethan M. <merritt@u.washington.edu> - 2006-05-10 17:34:08
|
On Wednesday 10 May 2006 10:01 am, Daniel J Sebald wrote:
> Hans-Bernhard Br=F6ker wrote:
> > I haven't experimented with Ethan's histogram plotting=20
> > machine enough to know how much better it might be at this same task.

The "with histograms" style only assists in plot layout.
It does not do any statistical analysis on its own.
I use external scripting to prepare the data for plotting.
=20
> That is why I asked the question. =20
> I've seen Ethan's histogram demos, looked at the script, but=20
> total understand if it does the binning and now that 'histeps'=20
> comment is obsolete.  =20

I have not myself ever found a use for 'histeps'.
But different people plot different things, so I cannot
conclude that it is obsolete.

The 'histograms' plot mode basically automates what would
otherwise be a very cumbersome set of commands using either
'impulses' or 'boxes'.

You can use 'impulses' to created row-stacked histogram plots
by setting the linewidth appropriately and explicitly giving
appropriate summations in the plot command.

E.g.
    set style histogram rowstacked
    plot 'foo' u 1, '' u 2, '' u 3

is more or less equivalent to
    set style impulses
    plot 'foo' u ($1+$2+$3), '' u ($1+$2), '' u ($3)

Similarly you can use 'boxes' to generate clustered histogram
plots by explicitly giving x-axis offsets to the contributing
data sets.

E.g.
    set style histogram cluster
    plot 'foo' u 1, '' u 2, '' u 3

is more or less equivalent to
    set style boxes
    set boxwidth 0.1 abs
    plot 'foo' u ($0-.2):1, '' u ($0):2, '' u ($0+.2):3

In either case the histograms style also allows additional
features such as automatic construction of appropriate
key entries, placement of axis labels, and multiple=20
histograms on the same set of axes.


=2D-=20
Ethan A Merritt
Biomolecular Structure Center
University of Washington, Seattle WA
|
|
From: Daniel J S. <dan...@ie...> - 2006-05-10 16:55:05
|
Petr Mikulik wrote: >>>> It is. "help set noclabel" >>> >>> >>> Please think how to add this info into gnuplot's help. I've asked the >>> same question some time ago. >> >> >> It already is. 'help set contour' mentions 'set clabel', and 'help >> set clabel explains' what it does. > > > Yes, it mentions ... but that easy solution how to draw all them black > is not evident -- then, example will help users a lot! > >>>> I would: it's not needed. You have rand(), you have invnorm, that's >>>> all you need. Also see 'stat.inc'. >> >> >>> A candidate for being added into "help rand". >> >> >> I don't thinks so. There's nothing to be gained from turning the >> gnuplot help into a generic maths textbook. > > > Of course, but why not help users? So long as the documentation is reasonably good (which isn't the case with clabel, I claim) and there are some demos illustrating the method, that is good enough in my mind. The prob3.dem I sent should illustrate both of the above. Dan |
|
From: Daniel J S. <dan...@ie...> - 2006-05-10 16:52:42
|
Hans-Bernhard Br=F6ker wrote: > Daniel J Sebald wrote: >=20 >> I assume that the following is still a correct statement with the=20 >> latest version of gnuplot: >> >> `histeps` is only a plotting style; `gnuplot` does not have the=20 >> ability to >> create bins and determine their population from some data set. >=20 >=20 > Not strictly. Since version 4.0 at least, there's a rudimentary=20 > histogram collection tool available: the 'smooth frequency' filter: >=20 > binwidth =3D 5 > bin(x) =3D binwidth * floor(x / binwidth) > plot 'data' using (bin($1)):1 w histeps >=20 > To my shame I haven't experimented with Ethan's histogram plotting=20 > machine enough to know how much better it might be at this same task. That is why I asked the question. I've seen Ethan's histogram demos, loo= ked at the script, but total understand if it does the binning and now th= at 'histeps' comment is obsolete. Anyway, if that prob3.dem I gave can be used, I'd think that doing a hist= ogram of randomly generated data would be a worthwhile addition. Dan |
|
From: Daniel J S. <dan...@ie...> - 2006-05-10 16:47:37
|
Hans-Bernhard Br=F6ker wrote: >> 3) It sure is annoying going through the trouble of looking up in=20 >> "test" (x11) the number of the symbol desired, and then the symbol=20 >> comes out differently in the output file (png). =20 >=20 >=20 > Well, then don't. As it's said throughout engineering: test what you=20 > fly, not what is easy to test. There's no particularly strong reason=20 > not to optimize the plot directly in PNG format. This was actually some quirkiness in the PNG library, not a problem subst= ituting some symbol for another. Ethan has taken care of this. >=20 >> Actually, I'd think that the "linecolor", "pointtype" is an extraneous= =20 >> syntax. Couldn't it just be "points type 7 color rgb "black""? =20 >=20 >=20 > No, because that syntax would fail miserably in the case of 'with=20 > linespoints': what type does "type" address: that of the points, or tha= t=20 > of the lines? Good point. Couple things, not that it really matters too much. Is the = linespoints a special combination? Or is the combination of two things c= ontrollable independently? If the latter, an "and" would make sense, e.g= ., plot x with lines type 7 color rgb "raspberry" and points type 3 color rg= b "muave" If it is the latter, the parser could be written to recognize "points typ= e 7" as shorthand for "points pt 7"... at which point it is just getting = to be too many abbreviations, etc. So, eh. >=20 >> 4) In a related category would be contours. I wanted to force the=20 >> contours to be all of the same color, in this case black. That=20 >> doesn't seem possible. >=20 >=20 > It is. "help set noclabel" OHHHHHH! "unset clabel"!!! Having turned off the key, I guess it wasn't= that obvious that "clabel" that should be unset. This just isn't very o= bvious. >=20 >> 5) In the example, I really only want about 25 samples. IS THERE=20 >> SOME WAY TO CONTROL THIS? Setting the samples # doesn't seem to=20 >> effect this. =20 >=20 >=20 > You'll have to elaborate. Exact input, output, and a description why=20 > the output isn't what you wanted, please. The "table" option works fairly well. >=20 >> 6) Would anyone object to a patch for a math function "randn()"=20 >> generating unit variance normal distribution random values using the=20 >> Box-Mueller method? =20 >=20 >=20 > I would: it's not needed. You have rand(), you have invnorm, that's al= l=20 > you need. Well, yes that will work. (Should have occurred to me I guess.) How abo= ut including the attached prob3.dem in the demos somewhere. It will give= an example of generating non-uniform r.v.s, (none of the probability or = random demos actually seem to do that). It will also give an example of = monochrome contour lines. It also gives an example of using "table". Interestingly, your pointing this out made me search the web a bit more a= nd I found a discussion by Marsaglia on the Wolfram forums list where he = states some confusion surrounding the specific form of the polar techniqu= e attributed to him. Guess that shows the importance of going back to th= e original article. Anyway... >> Also see 'stat.inc'. Gee, I didn't even know that definition file existed. But what about the= contents of that file has to do with the invnorm() function or generatin= g r.v.s? >=20 >> 7) Anyone notice that the above example in the x11 terminal is rather= =20 >> slow refresh (even when the sample points are not included)? I=20 >> realize that it takes a while to create the rendering of hidden lines=20 >> with so many iso-lines, but once it is drawn one would think the=20 >> refresh in gnuplot-x11 would be fairly fresh. =20 >=20 >=20 > An why would one think that? What made you think hidden3d would work=20 > faster on replots? >=20 >> Yes, it has a lot of lines; but still, drawing lines shouldn't be so >> slow. >=20 >=20 > Drawing them isn't. Determining those that are not to be drawn is. No, not "replot", I used the word "refresh" on purpose implying resizing = the gnuplot-x11 window or anything that redraws it. One would think once= that series of lines are inside of gnuplot-x11's buffer (i.e., the gnupl= ot core has already figured out what lines are hidden, etc.) redrawing th= em shouldn't be too slow. Dan |
|
From: Daniel J S. <dan...@ie...> - 2006-05-10 16:00:06
|
Hans-Bernhard Br=F6ker wrote: >> The idea would be that for terminals which don't support term->image()= =20 >> there would be a base version of image_rhombus() (or some such thing)=20 >> that draws an image using rhombuses and effectively acts the way pm3d=20 >> currently does. >=20 >=20 > Feel free to write a do_image(), put it in term.c, and add it do the=20 > adapter class by updating the "class loader". OK, thanks. That is sort of what I had envisioned early on, but didn't w= ant to touch too much code initially. Dan |
|
From: Petr M. <mi...@ph...> - 2006-05-10 14:33:48
|
>>> It is. "help set noclabel" >> >> Please think how to add this info into gnuplot's help. I've asked the same >> question some time ago. > > It already is. 'help set contour' mentions 'set clabel', and 'help set > clabel explains' what it does. Yes, it mentions ... but that easy solution how to draw all them black is not evident -- then, example will help users a lot! >>> I would: it's not needed. You have rand(), you have invnorm, that's all >>> you need. Also see 'stat.inc'. > >> A candidate for being added into "help rand". > > I don't thinks so. There's nothing to be gained from turning the gnuplot > help into a generic maths textbook. Of course, but why not help users? --- PM |
|
From:
<br...@ph...> - 2006-05-10 14:23:47
|
Petr Mikulik wrote: >> It is. "help set noclabel" > > Please think how to add this info into gnuplot's help. I've asked the > same question some time ago. It already is. 'help set contour' mentions 'set clabel', and 'help set clabel explains' what it does. >> I would: it's not needed. You have rand(), you have invnorm, that's >> all you need. Also see 'stat.inc'. > A candidate for being added into "help rand". I don't thinks so. There's nothing to be gained from turning the gnuplot help into a generic maths textbook. |
|
From: Petr M. <mi...@ph...> - 2006-05-10 13:43:12
|
>> 4) In a related category would be contours. I wanted to force the >> contours to be all of the same color, in this case black. That doesn't >> seem possible. > > It is. "help set noclabel" Please think how to add this info into gnuplot's help. I've asked the same question some time ago. > I would: it's not needed. You have rand(), you have invnorm, that's all you > need. Also see 'stat.inc'. A candidate for being added into "help rand". --- PM |
|
From:
<br...@ph...> - 2006-05-10 13:27:46
|
Daniel J Sebald wrote: > I'm not completely following, and I think I'm still wondering about the > terminal function mechanism. Perhaps I'm used to thinking of C++ where > one can override the function of a class and in some cases if base > object in question doesn't have an overriding function, the function > falls back to the base function. That's quite exactly what term.c does. But being written in C, it has to be done manually, instead of some C++ runtime magic doing it for us. term/README should be clear enough, really, but here's how it works: struct TERMENTRY is an interface (an pure abstract base class, in C++ jargon). An adapter class (providing fall-back implementations for several of TERMENTRY's methods) is in term.c. Viz. do_arrow(), do_point()... Each terminal driver is a derived class of this adapter. It will implement some methods, but doesn't have to implement all. Those it doesn't implement are marked by zeroes in the TERM_ENTRY part of the .trm file. The "class loader" in term.c replaces those dummies by the adapter classes implementations. > > The idea would be that for terminals which don't support term->image() > there would be a base version of image_rhombus() (or some such thing) > that draws an image using rhombuses and effectively acts the way pm3d > currently does. Feel free to write a do_image(), put it in term.c, and add it do the adapter class by updating the "class loader". |
|
From:
<br...@ph...> - 2006-05-10 13:21:12
|
Daniel J Sebald wrote: > 2) 3D plot layout is definitely the thing most in need of work post > 4.2. The default colorbox seems too big and out of place. The x-y > plane position seems slightly limited. Let me give an example to > illustrate a few things. The following is meant to show a zero mean, > unit variance Gaussian r.v. density. The contour is supposed to > represent the variance in some way, and there are supposed to be a set > of Gaussian samples with zero mean, unit variance. > set hidden3d > set contour > set isosamples 60 > set view 68, 28, 1, 1 > unset key > unset title > set cntrparam levels discrete 0.1 > set style line 1 linecolor rgb "black" > set term x11 2 > set parametric > set xrange [-5:5] > set yrange [-5:5] > set urange [-5:5] > set vrange [-5:5] > set xyplane at -0.2 > splot u,v,( 1/(2*pi) * exp(-0.5 * (u**2 + v**2)) ) with line ls 1, \ > sqrt(-2*log(rand(0)))*cos(2*pi*rand(0)),sqrt(-2*log(rand(0)))*sin(2*pi*rand(0)),-0.2 > with points pointtype 7 linecolor rgb "black" > > My intent was to have the points on the x-y plane and drop the x-y plane > to leave enough space that the surface plot doesn't obstruct the > points. Using the "set xyplane #" just didn't seem to get me there. > The axes would remain the same and the x-y plane would extend off the > plot, which just seemed silly. > > Then "set xyplane at -0.2" and setting the z-value of the points to -0.2 > puts the points and x-y plane in the same plane, but notice that the > line of the z-axis still extends down to where the xyplane used to be. > (That's a bug, isn't it? Or am I missing something?) Consequently, the > plot isn't using the space efficiently. > > 3) It sure is annoying going through the trouble of looking up in > "test" (x11) the number of the symbol desired, and then the symbol comes > out differently in the output file (png). Well, then don't. As it's said throughout engineering: test what you fly, not what is easy to test. There's no particularly strong reason not to optimize the plot directly in PNG format. > Actually, I'd think that the "linecolor", "pointtype" is an extraneous > syntax. Couldn't it just be "points type 7 color rgb "black""? No, because that syntax would fail miserably in the case of 'with linespoints': what type does "type" address: that of the points, or that of the lines? > 4) In a related category would be contours. I wanted to force the > contours to be all of the same color, in this case black. That doesn't > seem possible. It is. "help set noclabel" > 5) In the example, I really only want about 25 samples. IS THERE SOME > WAY TO CONTROL THIS? Setting the samples # doesn't seem to effect > this. You'll have to elaborate. Exact input, output, and a description why the output isn't what you wanted, please. > 6) Would anyone object to a patch for a math function "randn()" > generating unit variance normal distribution random values using the > Box-Mueller method? I would: it's not needed. You have rand(), you have invnorm, that's all you need. Also see 'stat.inc'. > 7) Anyone notice that the above example in the x11 terminal is rather > slow refresh (even when the sample points are not included)? I realize > that it takes a while to create the rendering of hidden lines with so > many iso-lines, but once it is drawn one would think the refresh in > gnuplot-x11 would be fairly fresh. An why would one think that? What made you think hidden3d would work faster on replots? > Yes, it has a lot of lines; but still, drawing lines shouldn't be so > slow. Drawing them isn't. Determining those that are not to be drawn is. |
|
From:
<br...@ph...> - 2006-05-10 13:12:28
|
Daniel J Sebald wrote: > I assume that the following is still a correct statement with the latest > version of gnuplot: > > `histeps` is only a plotting style; `gnuplot` does not have the ability to > create bins and determine their population from some data set. Not strictly. Since version 4.0 at least, there's a rudimentary histogram collection tool available: the 'smooth frequency' filter: binwidth = 5 bin(x) = binwidth * floor(x / binwidth) plot 'data' using (bin($1)):1 w histeps To my shame I haven't experimented with Ethan's histogram plotting machine enough to know how much better it might be at this same task. |
|
From: Petr M. <mi...@ph...> - 2006-05-10 09:00:29
|
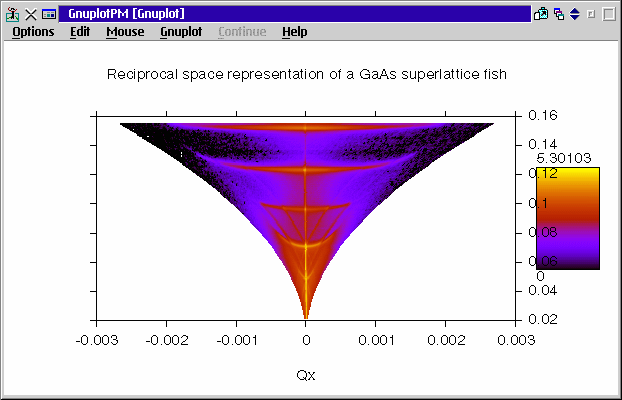
> Well ... storing 2500 boxes means 7500 lines of output like this for > my terminal (which also renders awfully): if these boxes don't have the same size, or non-rect final shape, then you must really save them. See e.g. http://gnuplot.sourceforge.net/demo_4.1/pm3d.29.png http://www.sci.muni.cz/~mikulik/figs/gp-pm3d-GaAsFish.gif Could you store it more effiently (even when processed by pm3dCompress.awk?) --- PM |

|
From: Petr M. <mi...@ph...> - 2006-05-10 08:53:56
|
> I'm sending a sample .ps file with gradient fill for the default palette. > > I calculated the values at 11 equally spaced points and converted them > > I don't know enough about PostScript language to be able to tell how > /data can be calculated in the PostScript file itself, but I'm almost > sure that it is possible. In any case gnuplot can calculate those 11 > (or more) values if needed. Please how a look into scripts pm3dCompress.awk and pm3dConvertToImage.awk how the online calculation of colors using RGB formulae can be done. BTW, do you know these scripts? They were written ages ago exactly for the purpose of making the ps files smaller. > I need my own version of drawing "smooth_box" (the terminal supports > vector graphic format, so drawing a whole lot of rectangles of single > color is extremely inefficient). Well, if you need it *now*, just write an awk/sed script which replaces it in-place. > Sure, but that doesn;t mean that it couldn't be rendered more > efficiently. Then this would require that gnuplot looks at the data *before* drawing them, tests pixel coordinates whether they form an equidistant grid (matrix), and if yes, then call the image() routine instead of the pm3d drawing routine. A similar test was there for the purpose of "with image", but it was removed (you could not set the tolerance). > (One would loose the ability to manualy change the > palette in the PostScript file afterwards (since gnuplot should > calculate the colors before drawing an image as opposed to the current > situation where PostScript calculates the proper color) no, see above >> Thus you mean to automagically change "with pm3d" into "with image" without >> knowing it to user? That's not a good idea I think. > > The user shouldn't notice any difference. But how *exactly* gnuplot makes the switch? See may comments on tolerance above. > OK. Let me try to explain, For drawing the "plotting area" in this > image (http://gnuplot.sourceforge.net/demo_4.1/pm3d.8.png), which is > nothing else but a bitmap image, gnuplot calls my terminal > term->set_color(...) > term->fillbox(...) > 49 x 49 times. For bitmap teminal this doesn't really matter, but for > my terminal it means constructing 49x49 paths and fill each one of > them separately (bot at compile time of the image and when displaying > it in GhostView or Acrobat), not to mention aliasing-artefacts (I > don't know how they are called, but GhostView shows white stripes all > over the plot). This is extremely inefficient. It would be much better > if gnuplot would call a routine > term->image(49,49, ....) > The result would be the visually the same (only better since no I think this is user's error: he should use "with image" and not "with pm3d" if he wants to draw a matrix instead of individual rectangles. Given the documentation for both styles (see gnuplot's help), they operate exactly as designed and documented. Of course an improved performance is nice, but that's why "with image" has been implemented. Thus, now there is the only question how to write the smallest code to draw the colour box with as short code as possible for any value of maxcolors. --- PM |
,)
|
From: Daniel J S. <dan...@ie...> - 2006-05-10 08:48:24
|
I assume that the following is still a correct statement with the latest version of gnuplot: `histeps` is only a plotting style; `gnuplot` does not have the ability to create bins and determine their population from some data set. Dan |
|
From: Ethan A M. <merritt@u.washington.edu> - 2006-05-10 06:20:43
|
On Tuesday 09 May 2006 11:08 pm, Ethan A Merritt wrote: > > I can think of several workarounds for this, but I'm not > sure what the cleanest is. Maybe draw the circle first > in some junk color, fill to *that* border, and then > re-trace in the real color? Not worth it. Recent versions of libgd have a gdImageFilledArc() function instead. I'll just use that and let older installations (gd version < 2) live with the bug. After all, it's been that way for 5 years already. -- Ethan A Merritt Biomolecular Structure Center University of Washington, Seattle 98195-7742 |
|
From: Ethan A M. <merritt@u.washington.edu> - 2006-05-10 06:08:19
|
On Tuesday 09 May 2006 10:38 pm, Ethan A Merritt wrote: > On Tuesday 09 May 2006 10:20 pm, Daniel Sebald wrote: > > my version of the PNG library creats hollow points even when > > they land inside the plot. (See plot.) > > Indeed. Mine too. > I have no idea why, but the bug must be in libgd. Heh. Actually, it's not a libgd bug. The circle is filled using a "fill to border" command, where the border color is the circle. But if the center of the current circle happens to already have that color, as for instance if there is another overlapping filled circle there already, then "fill to border" is a no-op. I can think of several workarounds for this, but I'm not sure what the cleanest is. Maybe draw the circle first in some junk color, fill to *that* border, and then re-trace in the real color? -- Ethan A Merritt Biomolecular Structure Center University of Washington, Seattle 98195-7742 |
|
From: Mojca M. <moj...@gm...> - 2006-05-10 05:15:15
|
On 5/10/06, Ethan Merritt wrote: > On Tuesday 09 May 2006 03:52 pm, you wrote: > > I'm sending a sample .ps file with gradient fill for the default palett= e. > > > > I calculated the values at 11 equally spaced points and converted them > > into hex numbers, now stored in /data. PostScript terminal currently > > draws 1024 single-color rectangles. Does anyone notice any difference > > in the palette produced by gradient fill and the one produced by 1024 > > samples? > > Aha. You are using Level 3 extensions to PostScript. > > They are not mentioned in the PostScript Language Reference Manual > (2nd Edition) that I have on my shelf. > Your test file displays on my older machines, which surprises me, > but the result looks truly awful. My new machines have a newer gs > installed that does indeed support these extensions. > > I guess I should go out and buy a new copy of the Language > Reference Manual. I downloaded the documentation and examples of files with smooth shading from Adobe (it's not meant to be taken on holidays as reading for relaxation ;). I'm sorry - I didn't thought about older machines (Level3 is from the last century, but I agree that mostly older PS printers might experience problems with it.) Level-dependent code generation would be great! > > OK. Let me try to explain, For drawing the "plotting area" in this > > image (http://gnuplot.sourceforge.net/demo_4.1/pm3d.8.png), which is > > nothing else but a bitmap image, gnuplot calls my terminal > > term->set_color(...) > > term->fillbox(...) > > 49 x 49 times. For bitmap teminal this doesn't really matter, but for > > my terminal it means constructing 49x49 paths and fill each one of > > them separately (bot at compile time of the image and when displaying > > it in GhostView or Acrobat), not to mention aliasing-artefacts (I > > don't know how they are called, but GhostView shows white stripes all > > over the plot). > > Yeah, we know. That is the down-side of newer versions of gs/gv/ghostvie= w. > They have a bad aliasing bug. It's a known bug, but even if they fix it > there will be a lot of broken installations for a long time to come. > > > This is extremely inefficient. It would be much better > > if gnuplot would call a routine > > term->image(49,49, ....) > > The result would be the visually the same (only better since no > > artefacts would occur) and both compiling and rendering would be more > > efficient. If the driver doesn't support "images", it can still draw > > 49 times 49 filled rectangles. > > But how does the higher level code tell a driver what to put in those > 49x49 boxes? In the general case each one has a different color, so > I do not see how you end up saving anything. Well ... storing 2500 boxes means 7500 lines of output like this for my terminal (which also renders awfully): gp_set_color_frac(0.1641); p :=3D (104.66,20.10)--(108.91,20.10)--(108.91,20.47)--(104.66,20.47)--cycl= e; gp_fill(p,1); Storing a field of 2500 RGB tripples means 7500 bytes instead and is also rendered much more efficiently and with no antialiasing problems. In the first case you also have to save coordinates, not only the color (I could save some space with shorter names and such, but that woudn't have much influence on efficiency). Mojca |
|
From: Daniel J S. <dan...@ie...> - 2006-05-10 03:32:13
|
Daniel J Sebald wrote: > OK, it can be done. The "table" method will allow first creating the > random data in a file than reading it back. This just about does it: Oh, but "set isosamples <#>,1" will not work. I want a prime number of random points. ;-) Dan |
|
From: Daniel J S. <dan...@ie...> - 2006-05-10 03:23:14
|
Ethan Merritt wrote:

>>The x-y plane position seems slightly limited.
>
>
> Works fine for me.
>
>
>>The axes would remain the same and the x-y plane would extend off the plot,
>>which just seemed silly.


Somehow I generated an x-y plane which landed outside the plot area.  Can't seem to reproduce that now.

>
>
> ???
> I don't understand.  You set the intersection of the plane with
> the Z axis at -0.2, and that's where it is drawn.  What did you expect?

No, initially I tried something like "set xyplane 0.7" or something.

>
>
>>Then "set xyplane at -0.2" and setting the z-value of the points to -0.2
>>puts the points and x-y plane in the same plane, but notice that the
>>line of the z-axis still extends down to where the xyplane used to be.
>>(That's a bug, isn't it?  Or am I missing something?)
>
>
> Um. I don't know. For me the z-axis extends to span the range
> currently set by "set zrange".  That has nothing in particular
> to do with where the xyplane is currently set.

Well, that seems to work as expected, i.e., the range as described by the little tic marks.  It's that "x-y plane drop down line", and oddly only for the one on the z-axis.  The other three are the correct length.

>
>>3)  It sure is annoying going through the trouble of looking up
>>in "test" (x11) the number of the symbol desired,
>>and then the symbol comes out differently in the output file (png).
>
>
> User error.
> If you want to know what the png symbols look like,
> test them with the png driver.
>
>
>>Regardless of the different symbols from one output terminal to another,
>>I find it so confusing, because looking at "test" as a PNG output the "7"
>>is actually a solid symbol, but not in this example (see attached "normal.png").
>
>
> That's just because of the limited resolution.
> I don't think we can do anything about that.

Oy, this is a PNG thing.  Take a look at the difference between these plots.

set term png
set output 'plot.png'
plot x**2 with points pointtype 7 linecolor rgb "black"
set output 'plot2.png'
plot x**2 with points pointtype 7
set output

When PNG has a dot as the same color as a line or point it lands on, the dot is drawn hollow.  Not sure how that helps the visual effect.

>>Also, is it OK to use "linecolor rgb "black" to control symbol color as I did?
>
> Sure, if you want.  Or "lt -1".

Actually, lt -1 is a black line with a thickness greater than usual.  The surface plots look bad with such a thick line.

>
>
>>4)  In a related category would be contours.
>>I wanted to force the contours to be all of the same color, in this case black.
>>That doesn't seem possible.
>
>
> Yes it is. You just have to specify a specific color (lc rgb "blue")
> rather than a linetype.  If you give a linetype, it autoincrements
> as it draws each contour.

I can't seem to do this.  I see in "show cntrparam" that

        contour line types are varied & labeled with format '%8.3g'

suggesting that line types can be controlled.  But the documentation doesn't show how to set this.  Hmm, this seems to fall under "clabel".  Why would color be under that?  Anyway, the documentation says

 The first contour linetype, or only contour linetype when clabel is off, is
 the surface linetype +1; contour points are the same style as surface points.

but again no indication of how to change that behavior.  Would it be either of these:

set cntrparam linear lc rgb "black"
set clabel '' lc rgb "black"

This might be a good thing to add to "contours.dem".

>
>
>>5)  In the example, I really only want about 25 samples.
>>IS THERE SOME WAY TO CONTROL THIS?
>
>
> set isosamples 25, 25

This causes a surface with isolines of 25 by 25.  Well, I meant that I want to have the higher resolution isolines (60), but only 25 outcomes of a multivariate Gaussian.  But I gather that this works by generating a random value for every point in the grid, i.e., 25 x 25 points.  Now, that behavior is one I would say makes the rand function (at least on its own) really only good for demos...  Oh, hold on here...

OK, it can be done.  The "table" method will allow first creating the random data in a file than reading it back.  This just about does it:

set hidden3d
set contour
set view 68, 28, 1, 1
unset key
unset title
set cntrparam levels discrete 0.1 lc rgb "black"
set style line 1 linecolor rgb "black"
set term x11 2
set parametric
set xrange [-4:4]
set yrange [-4:4]
set zrange [-0.2:0.2]
set urange [-4:4]
set vrange [-4:4]
set xyplane 0
set isosamples 5,5
set table "temp.dat"
splot sqrt(-2*log(rand(0)))*cos(2*pi*rand(0)),sqrt(-2*log(rand(0)))*sin(2*pi*rand(0)),-0.2
unset table
set isosamples 60
splot u,v,( 1/(2*pi) * exp(-0.5 * (u**2 + v**2)) ) with line ls 1, \
   "temp.dat" with points pointtype 7 linecolor rgb "black"

>
>
>>6)  Would anyone object to a patch for a math function "randn()"
>>generating unit variance normal distribution random values using
>>the Box-Mueller method?
>
>
> Other than generating demo plots, is there really a need?

Sure.  I want to generate a plot illustrating a Gaussian mixture model, which means a lengthy polar transform equation for each of the components of the mixture.  It's far fetched that someone would use gnuplot for simulations.  But for quickly generating little illustrations in physics, communications, stats, etc. Gaussian distributions pop up fairly often.

Dan
|
|
From: Ethan M. <merritt@u.washington.edu> - 2006-05-10 01:45:30
|
On Tuesday 09 May 2006 05:56 pm, Daniel J Sebald wrote: > > 1) Is the CVS synched with what developers have checked in? No. 6 weeks out of date and a lot of water under the bridge. > If so, there is still a problem with arrow style parsing No. Fixed (6-delta) weeks ago. > 2) 3D plot layout is definitely the thing most in need of work post 4.2. > The default colorbox seems too big and out of place. So change it. You don't have to use the default if you don't like it. > The x-y plane position seems slightly limited. Works fine for me. > The axes would remain the same and the x-y plane would extend off the plot, > which just seemed silly. ??? I don't understand. You set the intersection of the plane with the Z axis at -0.2, and that's where it is drawn. What did you expect? > Then "set xyplane at -0.2" and setting the z-value of the points to -0.2 > puts the points and x-y plane in the same plane, but notice that the > line of the z-axis still extends down to where the xyplane used to be. > (That's a bug, isn't it? Or am I missing something?) Um. I don't know. For me the z-axis extends to span the range currently set by "set zrange". That has nothing in particular to do with where the xyplane is currently set. > 3) It sure is annoying going through the trouble of looking up > in "test" (x11) the number of the symbol desired, > and then the symbol comes out differently in the output file (png). User error. If you want to know what the png symbols look like, test them with the png driver. > Regardless of the different symbols from one output terminal to another, > I find it so confusing, because looking at "test" as a PNG output the "7" > is actually a solid symbol, but not in this example (see attached "normal.png"). That's just because of the limited resolution. I don't think we can do anything about that. > Also, is it OK to use "linecolor rgb "black" to control symbol color as I did? Sure, if you want. Or "lt -1". > 4) In a related category would be contours. > I wanted to force the contours to be all of the same color, in this case black. > That doesn't seem possible. Yes it is. You just have to specify a specific color (lc rgb "blue") rather than a linetype. If you give a linetype, it autoincrements as it draws each contour. > 5) In the example, I really only want about 25 samples. > IS THERE SOME WAY TO CONTROL THIS? set isosamples 25, 25 > 6) Would anyone object to a patch for a math function "randn()" > generating unit variance normal distribution random values using > the Box-Mueller method? Other than generating demo plots, is there really a need? -- Ethan A Merritt Biomolecular Structure Center University of Washington, Seattle WA |
|
From: Ethan M. <merritt@u.washington.edu> - 2006-05-10 01:25:45
|
On Tuesday 09 May 2006 06:05 pm, Daniel J Sebald wrote: > OK, since SourceForge CVS seems to be working SourceForge is definitely not recovered yet. Their current status page says that they have not even taken full delivery of the replacement hardware they need, let alone installed and commissioned it. The source files I see on anonymous CVS are 6 weeks out of date. I can't even see the developer CVS files; they've been incommunicado since some time yesterday. It won't let me log in to the shell server either. -- Ethan A Merritt Biomolecular Structure Center University of Washington, Seattle WA |
|
From: Daniel J S. <dan...@ie...> - 2006-05-10 01:06:57
|
Ethan Merritt wrote: >>This is extremely inefficient. It would be much better >>if gnuplot would call a routine >> term->image(49,49, ....) >>The result would be the visually the same (only better since no >>artefacts would occur) and both compiling and rendering would be more >>efficient. If the driver doesn't support "images", it can still draw >>49 times 49 filled rectangles. > > > But how does the higher level code tell a driver what to put in those > 49x49 boxes? In the general case each one has a different color, so > I do not see how you end up saving anything. I'm not completely following, and I think I'm still wondering about the terminal function mechanism. Perhaps I'm used to thinking of C++ where one can override the function of a class and in some cases if base object in question doesn't have an overriding function, the function falls back to the base function. The idea would be that for terminals which don't support term->image() there would be a base version of image_rhombus() (or some such thing) that draws an image using rhombuses and effectively acts the way pm3d currently does. If there is image support, there is a big savings because the data is compact, i.e., a matrix of numbers as opposed to all the corners of each pixel, the rendering is better and faster at the driver or system call level, no aliasing issues, etc. Dan |
28 messages has been excluded from this view by a project administrator.

