Highcharts
Highcharts is a JavaScript charting library that allows developers to create interactive and visually appealing charts for web applications. It offers a wide range of chart types, including line charts, bar charts, pie charts, scatter plots, and more. It also supports different types of data, including CSV, JSON, and even live data streams. One of the key features of Highcharts is its ability to customize the look and feel of the charts. Developers can easily change the colors, font sizes, and other visual elements to match their brand or design. Additionally, it offers a variety of options for making charts responsive, so they look great on any device. Another great feature is the ability to add interactive elements to charts, such as hover effects, tooltips, and click events. This allows developers to create charts that are not only informative, but also engaging for users. Highcharts also supports exporting charts as PNG, JPEG, PDF, or SVG, making it easy to share or print them.
Learn more
Azore CFD
AzoreCFD has been a trusted, cutting-edge software tool since 2007. Azore focuses on analysis, design, engineering, and on obtaining precise, and quick results. Customers use Azore for applications that include: industrial flows, aerodynamics, thermal mixing, conjugate heat transfer, gas species mixing, heating and cooling systems, external flows, and more.
Azore can be used to simulate essentially any steady-state or transient fluid flow model, including problems that involve conjugate heat transfer and special transport. With flexible pre/post processing, Azore allows for arbitrary polyhedral mesh topology with several import formats supported. Built-in post-processing capabilities includes: scalar fields, pathlines, animations, residual reports, vector fields, ISO-surfaces, force & movement reports, and export for external post-processing.
Learn more
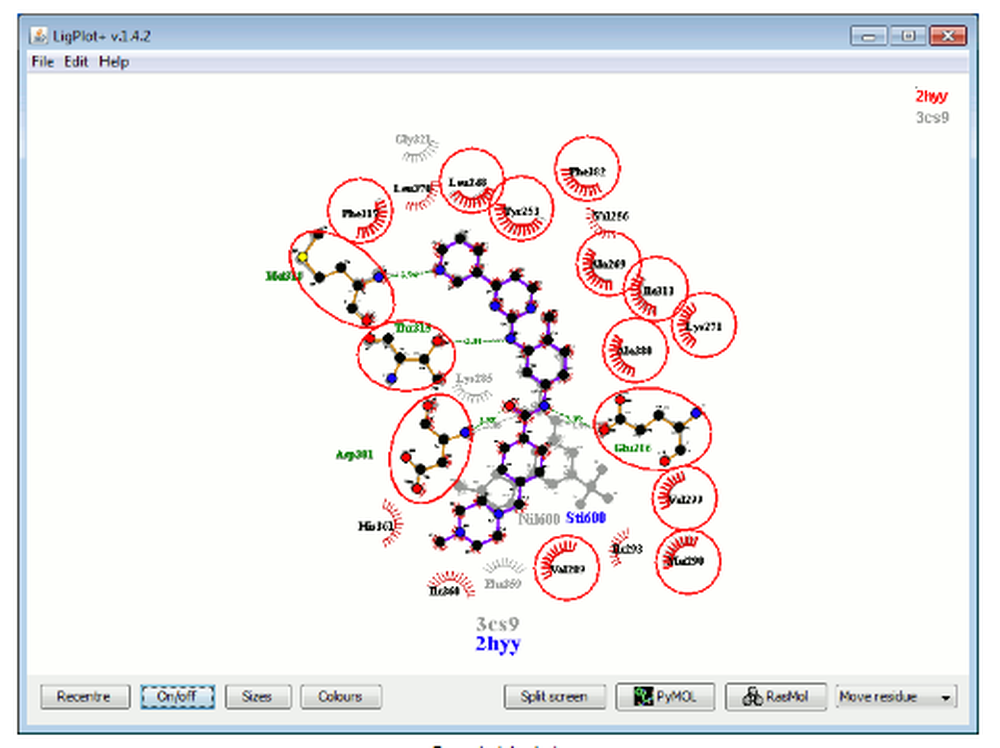
AutoDock
AutoDock is a suite of automated docking tools. It is designed to predict how small molecules, such as substrates or drug candidates, bind to a receptor of known 3D structure. Over the years, it has been modified and improved to add new functionalities, and multiple engines have been developed. Current distributions of AutoDock consist of two generations of software: AutoDock 4 and AutoDock Vina. More recently, we developed AutoDock-GPU, an accelerated version of AutoDock4 that is hundreds of times faster than the original single-CPU docking code. AutoDock 4 actually consists of two main programs: autodock performs the docking of the ligand to a set of grids describing the target protein; autogrid pre-calculates these grids. In addition to using them for docking, the atomic affinity grids can be visualized. This can help, for example, to guide organic synthetic chemists design better binders.
Learn more