Related Products
|
||||||
About
Splash AI is an AI-powered data analytics and visualization platform that enables users to effortlessly transform raw data into insights using natural-language prompts, no coding required. Users simply upload their data, ask for analysis in plain English, and receive instant, actionable results in the form of clean, interactive charts, tables, or full reports. It handles data cleaning, analysis, and visualization seamlessly, and offers use-case–specific dashboards like sales analytics (performance tracking and revenue forecasting), marketing ROI (campaign effectiveness and cohort trends), financial reporting (P&L flow via Sankey diagrams and margin insights), and customer insights (segmented behavior dashboards and funnels). Entire workflows, from upload to insight, are executed in minutes, eliminating complex setups.
|
About
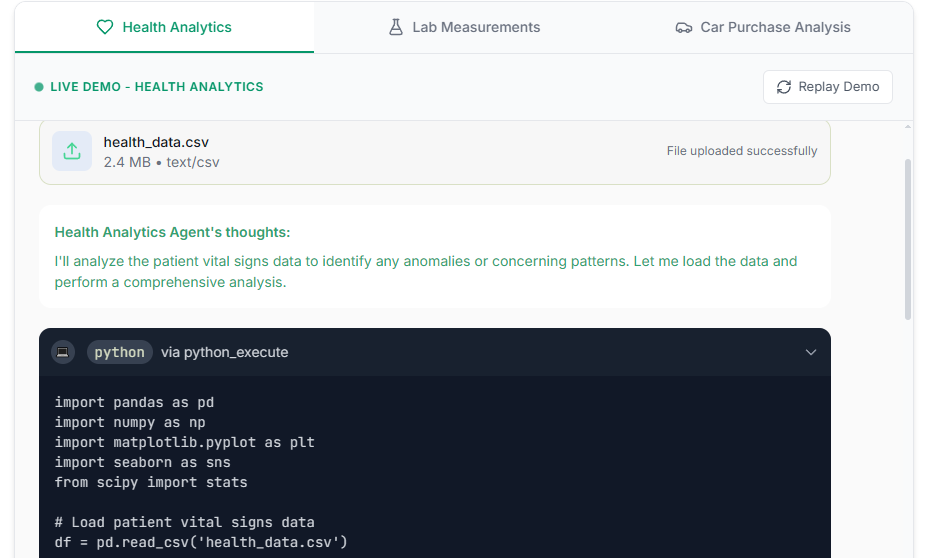
VibeChart is an AI‑powered data visualization platform that instantly transforms raw data, whether from files, spreadsheets, or even messy inputs, into stunning, customizable charts and diagrams. Built for speed, flexibility, and precision, its natural‑language Text‑to‑Chart interface supports over 40 chart types, enabling users to generate and refine visuals through simple prompts without manual formatting. A built‑in data engineer automatically cleans, transforms, and extracts insights from your datasets, while API & MCP access ensures reliable, sub‑2‑second chart generation with 99.9% uptime. Outputs are designed for seamless sharing, export as high‑resolution images, embeddable code, or direct exports to PowerPoint, Notion, Slack, and more, so teams can distribute insights at scale. Trusted by over 500 business and research teams, VibeChart removes the friction of manual charting so you can focus on interpreting results.
|
|||||
Platforms Supported
Windows
Mac
Linux
Cloud
On-Premises
iPhone
iPad
Android
Chromebook
|
Platforms Supported
Windows
Mac
Linux
Cloud
On-Premises
iPhone
iPad
Android
Chromebook
|
|||||
Audience
Business analysts, data-savvy professionals, and non-technical teams needing a solution to convert diverse data into visual insights using natural-language prompts
|
Audience
Business analysts, product managers, and research teams looking for a tool to convert data into shareable, professional charts instantly
|
|||||
Support
Phone Support
24/7 Live Support
Online
|
Support
Phone Support
24/7 Live Support
Online
|
|||||
API
Offers API
|
API
Offers API
|
|||||
Screenshots and Videos |
Screenshots and Videos |
|||||
Pricing
$20 per month
Free Version
Free Trial
|
Pricing
$20 per month
Free Version
Free Trial
|
|||||
Reviews/
|
Reviews/
|
|||||
Training
Documentation
Webinars
Live Online
In Person
|
Training
Documentation
Webinars
Live Online
In Person
|
|||||
Company InformationSplash AI
United States
aisplash.me/
|
Company InformationVibeChart
United States
vibechart.ai/
|
|||||
Alternatives |
Alternatives |
|||||
|
|
||||||
Categories |
Categories |
|||||
Integrations
Airtable
GPT-4
Gemini
Gemini Enterprise
Google Sheets
Google Slides
Instagram
JSON
LinkedIn
Microsoft Excel
|
Integrations
Airtable
GPT-4
Gemini
Gemini Enterprise
Google Sheets
Google Slides
Instagram
JSON
LinkedIn
Microsoft Excel
|
|||||
|
|
|