Redash
Connect and query your data sources, build dashboards to visualize data and share them with your company. Enjoy the power and comfort of a SQL client with the collaborative advantages of a cloud based service. Easily visualize your results in various formats: chart, cohort, pivot table, boxplot, map, counter, sankey, sunburst and word cloud. Share your data-story with colleagues, other teams or external partners. Access Redash via API and extend its functionality as you like. SSO, access control and many other great features for enterprise-friendly workflow.
Learn more
e!Sankey
The most popular software for creating Sankey diagrams. Visualize the material & energy flows or value streams in your company or along the supply chain. Share these appealing diagrams in reports or presentations. Data visualization is a great way to simplify and understand complex relationships in process systems. e!Sankey is the perfect tool for that! Sankey diagrams go beyond simple flow charts. Their arrows have a width proportional to the flow quantity and draw attention to the largest flows in the system. Design your Sankey diagrams in the net editor: Just draw arrows and processes to build your diagrams easily. Benefit from a clear entry and unit management, including unit conversions. Use e!Sankey to calculate flow quantities. This makes the generation of Sankey diagrams even more comfortable.
Learn more
Excelmatic
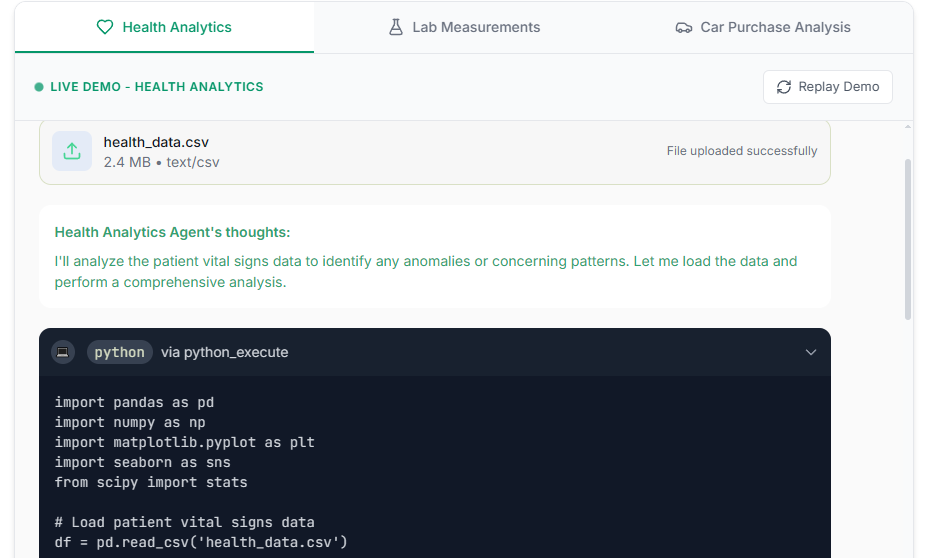
Excelmatic is an AI‑powered Excel companion that transforms raw spreadsheets into instant insights, analytics, and visualizations through a conversational interface. Users simply upload files, ask questions in natural language, and receive real‑time answers, charts, and KPI summaries without writing a single formula. Behind the scenes, Excelmatic automates data preparation, cleaning complex tables with customizable rules, intelligent type recognition, and batch processing, then applies advanced statistical analysis (trend analysis, anomaly detection, multi‑dimensional breakdowns) and generates professional charts (bar, line, pie, etc.) with dynamic updates and style customization. Its formula assistant further accelerates workflows by converting plain‑English prompts into accurate functions, offering an extensive library, error correction suggestions, and support for nested or array formulas. Additional capabilities include one‑click extraction of tabular data.
Learn more
AI Graph Maker
AI Graph Maker is a tool for creating clean, interactive data visualizations quickly and with minimal effort. It supports many chart and diagram types, like pie, bar, line, radar, Gantt, funnel, treemap, mind maps, flowcharts, org charts, knowledge graphs, timelines, and more, so you can represent hierarchical, categorical, temporal, or network data visually. You upload or input your raw data (or sometimes just use natural-language prompts), and the AI transforms it into polished charts; design, formatting, and layout are handled for you, with options to tweak visuals afterward. The UI is built to be user-friendly and responsive (works across devices), and you can export graphs in various formats (PNG, SVG, and even formats usable in tools) for further editing or embedding. The system emphasizes simplicity: you don’t need coding skills, and it delivers good visual clarity and customization in seconds.
Learn more