Paessler PRTG

Paessler PRTG

Paessler GmbH
+
+
Visit Website

About

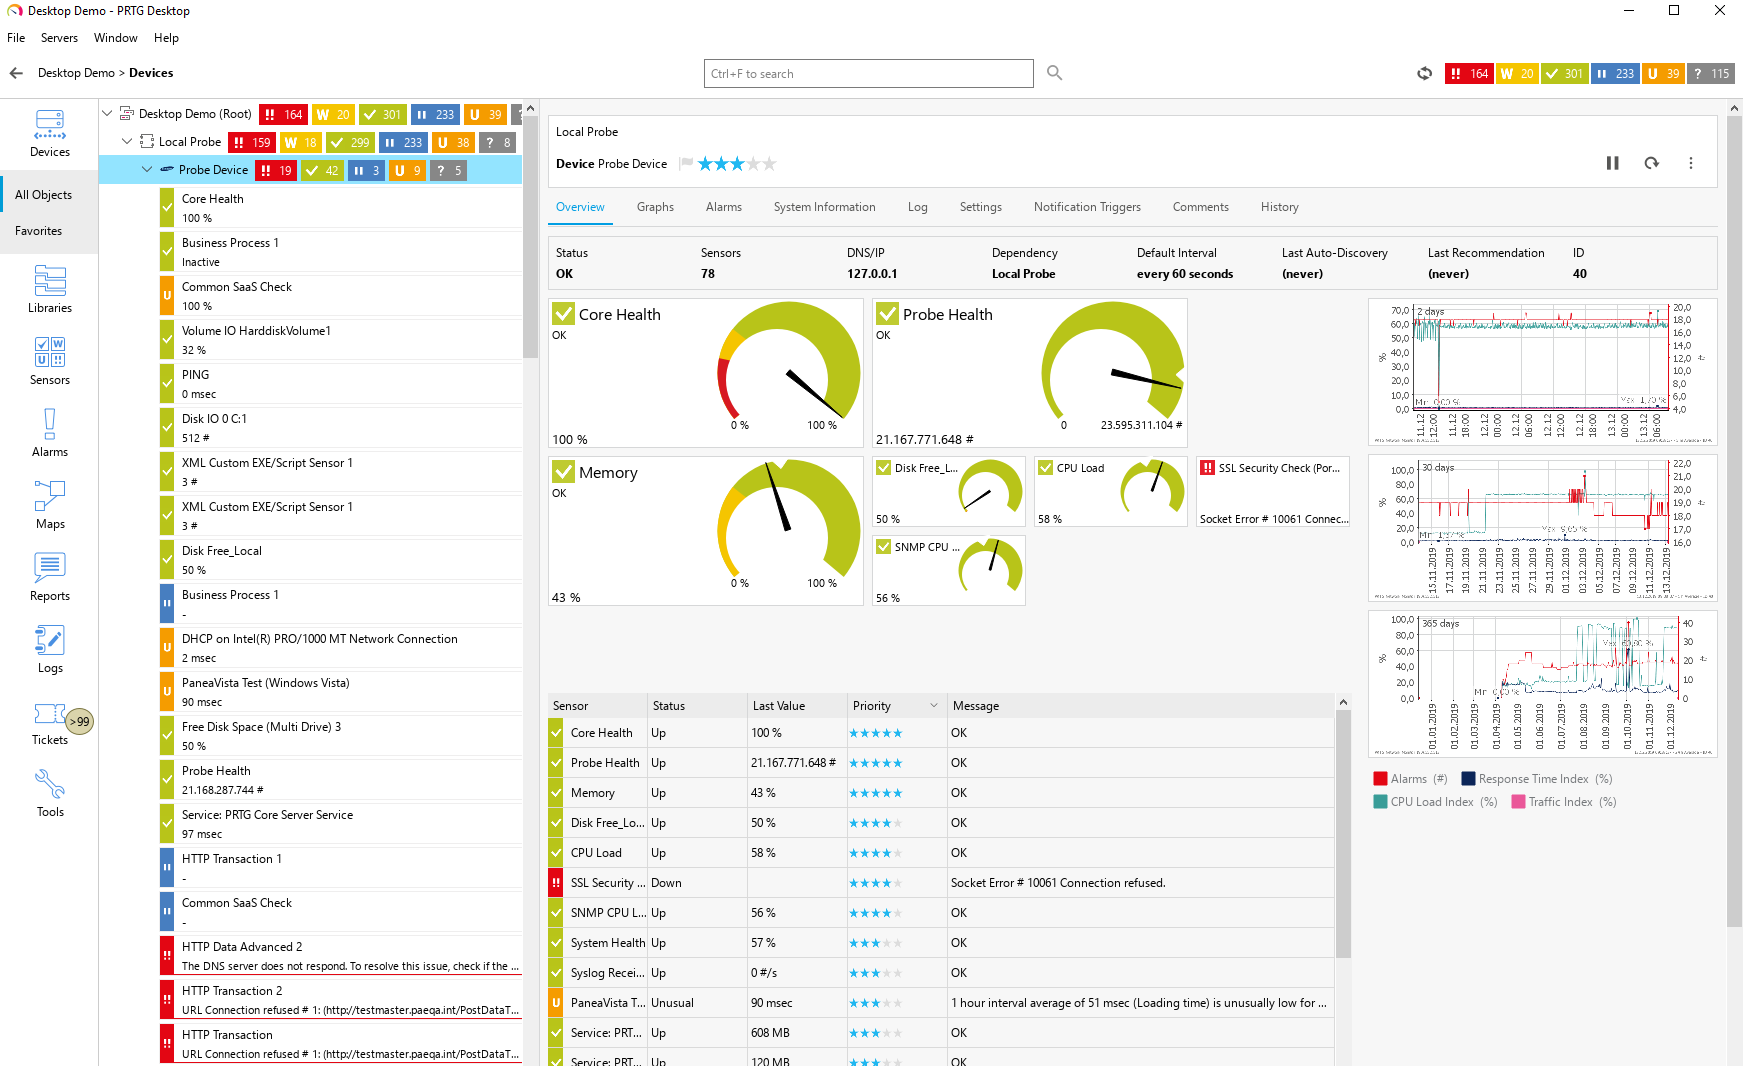
Paessler PRTG is an all-inclusive monitoring software solution developed by Paessler. Equipped with an easy-to-use, intuitive interface with a cutting-edge monitoring engine, PRTG optimizes connections and workloads as well as reduces operational costs by avoiding outages while saving time and controlling service level agreements (SLAs). The solution is packed with specialized monitoring features that include flexible alerting, cluster failover solution, distributed monitoring, in-depth reporting, maps and dashboards, and more. PRTG monitors your entire IT infrastructure. All important technologies are supported: • SNMP: ready-to-use and custom options • WMI and Windows Performance Counters • SSH: for Linux/Unix and macOS systems • Traffic analysis using flow protocols or packet sniffing • HTTP requests • REST APIs returning XML or JSON • Ping, SQL, and many more

About

PathSolutions TotalView network monitoring and troubleshooting software bridges the gap between NETWORK MONITORING and TROUBLESHOOTING RESOLUTION telling you WHEN, WHERE and WHY network errors occur. PathSolutions TotalView continuously monitors and tracks the performance of every device and every link in your entire network, going deeper than other solutions by collecting error counters, performance data, configuration information and connectedness. A built-in heuristics engine analyzes all of this information to produce plain-English answers to problems. This means that complex problems can be solved by junior level engineers leaving the senior level engineers to work on more strategic level projects. The core product includes everything needed to run a perfectly healthy network: Configuration management, server monitoring, cloud service monitoring, IPAM, NetFlow, path mapping, and diagramming. Get Total Network Visibility on your network and solve more problems faster.

Platforms Supported

Windows
Mac
Linux
Cloud
On-Premises
iPhone
iPad
Android
Chromebook

Platforms Supported

Windows
Mac
Linux
Cloud
On-Premises
iPhone
iPad
Android
Chromebook

Audience

Caters to tech staff, system administrators, and companies of any size, from small office/home office (SOHO) to enterprises that need their IT network to be reliable and easy to monitor on a real-time basis.

Audience

Medium sized companies

Support

Phone Support
24/7 Live Support
Online

Support

Phone Support
24/7 Live Support
Online

API

Offers API

API

Offers API

Screenshots and Videos

Screenshots and Videos

Pricing

$2149 for PRTG 500
PRTG 100
Free of charge
• 100 free sensors

PRTG 500- Start Small & Upgrade Later
From $2,149
500 Sensors

PRTG 1000- Small & Medium Sized Environments
From $3,899
1000 Sensors

PRTG 2500- Medium Sized Environments
From $8,099
2,500 Sensors

Best Value:
PRTG 5000- Large Environments
From $14,999
5,000 Sensors

PRTG 10000- Very Large Environments
From $17,899
10.000 Sensors

PRTG Enterprise
Custom Pricing
• Unlimited sensors
• Unlimited server installations

All pricing is based on a subscription basis.
Free Version
Free Trial

Pricing

$5,747 perpetual
Pricing is based on the size of the network and is priced based on the number of network interfaces in the environment. This would include all physical interfaces on network infrastructure devices: switches, routers, gateways, and firewalls. This count is put into discount buckets so the price is approachable by small, medium, and large enterprises.
Free Version
Free Trial

Reviews/Ratings

Overall 4.8 / 5
ease 4.6 / 5
features 4.6 / 5
design 4.5 / 5
support 4.6 / 5

Reviews/Ratings

Overall 4.9 / 5
ease 5.0 / 5
features 4.6 / 5
design 4.6 / 5
support 4.9 / 5

Pros & Cons from Real Users

Pros

  • The interface is very intuitive and easy to configure. PRTG supports a wide variety of sensors out of the box and can monitor almost any device or service through SNMP, WMI, API, or custom scripts. The automatic network discovery saves a lot of setup time, and the alerting system is flexible and reliable.
  • Easy Installation & Setup: Quick to install, straightforward to add devices; PRTG auto-discovers sensors with minimal input required. User-Friendly Interface: Clean interface with intuitive navigation—great for beginners and power users alike. Automatic Device & Sensor Discovery: PRTG finds and sets up relevant sensors for new devices automatically, minimizing manual configuration. Customizable Dashboards & Alerts: Effective visualization tools and flexible alerting keep you informed about network health. Free Version Available: The free version (up to 100 sensors) is more than sufficient for most home and small lab setups. Versatile Monitoring: Supports a wide range of devices and protocols (SNMP, WMI, flow, etc.), covering most network needs. Active Community & Documentation: Lots of online help and documentation for troubleshooting and tips.
  • PRTG is an amazingly simple tool that helps monitor all the equipment we have in our organization. With this system, in any malfunction or crisis, we can quickly diagnose the source of the problem and solve it in an instant. We have configured all the servers and equipment in the system and it knows how to give us a quick look as soon as something happens. And that way, we can diagnose the problem quickly.
  • We've had a very positive and satisfying experience with PRTG over the years. We've been using the product for several years now, and it's proven to be the perfect solution for monitoring our network infrastructure and applications. PRTG is intuitive and well-designed, making it easy to create detailed dashboards and maps that give us a clear visual representation of the status of critical machines and services. The notification system is also very well thought out, allowing us to react quickly to any anomalies. One of PRTG’s key strengths is that it's constantly evolving, which means we regularly gain access to new sensors that we can deploy to achieve more precise and comprehensive monitoring of our systems. The user community plays an essential role as well, often helping us solve very specific sensor-related issues. On top of that, the technical support team is responsive and effective, often providing spot-on answers that help resolve complex problems. At this point, we honestly can’t imagine working without PRTG — it’s become a central part of our IT operations.
  • The number of sensor types is outstanding. Not just SNMP but a multitude of standard sensor imputs are possible as well as custom scripts in various formats. The remote probe is great for multitenant or remote sites.

Cons

  • The web interface can become slow when handling very large environments with thousands of sensors. Some advanced reporting features require manual setup, and the mobile app, while functional, could be improved for better usability.
  • Sensor Counting Can Be Confusing: Some users find the way PRTG counts “sensors” (one sensor per metric) a bit confusing, which can eat up your free limit quickly. Resource Use: The software can be resource-intensive on larger setups; may require better hardware to run smoothly if scaling up. Overwhelming Amount of Data: For home users, the sheer volume of information and settings might be daunting at first. Interface Feels Dated to Some: While functional, a few users feel the web UI could use a more modern look. Limited by Free Tier: Advanced features and larger environments may require a paid license.
  • The price is very expensive and not suitable for every organization, which is a shame. If the price were more affordable, maybe more organizations would purchase it.
  • What I like less about the software is the way lookups are managed. It could be more user-friendly — right now, you have to manually edit text files directly on the probe, which isn't very convenient. There should be a dedicated interface for this, similar to how thresholds are managed. Also, the maps feature feels a bit limited, and there's a lack of confirmation prompts when deleting items. One wrong move and you can lose everything you've built. There should be more validation steps when modifying maps, especially for deletions. Just hovering over an item and accidentally clicking the trash icon can wipe out your work in an instant…
  • Hardware Scaling of large PRTG installations is something to plan ahead for

Pros from Real Users

Pros

  • Love the simplicity and customization of the product, its very easy to get devices monitored and to modify nearly anything. Being able to mass modify interfaces really saves time and the notifications are now business critical at my facility. The support is second to none if you run into issues, the BGP monitoring and integrated IPAM/Syslog really set TotalView a cut above their competitors.
  • Installation is quick and easy. Configuration is very straight forward and easy. Gives you a "TotalView" of your network and equipment. Can be up and running in a matter of minutes.
  • PathSolutions has been a wonderful product for us and the support is great. It's very easy to get in contact with someone at path solutions when you require assistance.
  • Right off the top, the ease of configuration and understanding the information available was the most import aspect for me with TotalView. The software aggregates information on multiple devices in a way that makes narrowing down a network issue much more effective. In addition, syslog and Netflow views are available right from the device pages speeding up information that is critical to a strong network foundation.
  • Quick and good information. Works well when you need to get some good information on devices. Decent product.
  • This is one of the easiest-to-install network monitoring and management systems ever. Anyone can get this up and running in under 15 minutes and, depending on your network, can be fully productive in under a day. We currently have 5 techs monitoring and managing 160 network switches in 50 buildings across 2 campuses and this is their #1 tool for monitoring, troubleshooting, and fixing issues. The user interface is clean, simple and fast which makes it extremely easy to find and resolve issues. One of the best features is the network prescription that will not only identify issues but provide you with an easy-to-understand explanation of the issue and how to resolve it.
  • I have been using PathSolutions for 15+ years. It has been a great product. I would recommend it to any IT Admin.
  • Price...Installation, initial configuration and training with Cris and Amy lasted until all my questions were answered. We run a call center with 80% remote users. Troubleshooting VOIP with WireShark or SNGREP is cool and all, but tech has other issues to solve. TotalView is running on my monitor, alerts are configured and I get better sleep.
  • Ease of use, completeness of features, ability to determine issues quickly, monitoring interfaces and links, MOS Tools, Interface histories, IP management, GREMLIN history!!!
  • Feature rich. Great support. Great documentation. Simple implementation. Extremely customizable network monitoring.

Training

Documentation
Webinars
Live Online
In Person

Training

Documentation
Webinars
Live Online
In Person

Company Information

Paessler GmbH
Founded: 1997
Germany
www.paessler.com

Company Information

PathSolutions
Founded: 2007
United States
www.pathsolutions.com

Alternatives

Auvik

Auvik

Auvik Networks

Alternatives

AdRem NetCrunch

AdRem NetCrunch

AdRem Software
Site24x7

Site24x7

ManageEngine
Statseeker

Statseeker

Techniche
Site24x7

Site24x7

ManageEngine
AdRem NetCrunch

AdRem NetCrunch

AdRem Software

Categories

Categories

Network Monitoring Features

Bandwidth Monitoring
Baseline Manager
Diagnostic Tools
Internet Usage Monitoring
IP Address Monitoring
Real Time Analytics
Resource Management
Server Monitoring
SLA Monitoring
Uptime Monitoring
Web Traffic Reporting

VoIP Monitoring Features

Alerts / Notifications
Call Detail Record (CDR) Analysis
Call Quality Monitoring
IP SLA Monitoring
Jitter Testing
Latency Monitoring
MOS Monitoring
Packet Loss Monitoring
QoS Monitoring
Reporting / Analytics
Troubleshooting

Database Monitoring Features

Anomaly Detection
Autodiscovery
Capacity Planning
Dashboard
Dependency Tracking
Historical Trend Analysis
Multitenancy
Notifications / Alerts
Performance Monitoring
Permissions / Access Controls
Predictive Analytics
Prioritization
Query Analysis
Resource Optimization
Troubleshooting

IT Infrastructure Monitoring Features

Alerts / Notifications
Application Monitoring
Bandwidth Monitoring
Capacity Planning
Configuration Change Management
Data Movement Monitoring
Health Monitoring
Multi-Platform Support
Performance Monitoring
Point-in-Time Visibility
Reporting / Analytics
Virtual Machine Monitoring

System Monitoring Features

Alerts / Notifications
Antivirus Management
Data Backup / Recovery
Device Monitoring
Inventory Management
Patch Management
Policy-based Automation
Remote Monitoring
Reporting / Analytics
Risk Analysis
Server Monitoring
Service Configuration Management

Website Monitoring Features

Availability Testing
Event Logs
Event-Based Notifications
FTP Monitoring
Mail Server Monitoring
Maintenance Scheduling
Performance Metrics
Real Time Monitoring
Transaction Monitoring
Uptime Reporting

Network Monitoring Features

Bandwidth Monitoring
Baseline Manager
Diagnostic Tools
Internet Usage Monitoring
IP Address Monitoring
Real Time Analytics
Resource Management
Server Monitoring
SLA Monitoring
Uptime Monitoring
Web Traffic Reporting

VoIP Monitoring Features

Alerts / Notifications
Call Detail Record (CDR) Analysis
Call Quality Monitoring
IP SLA Monitoring
Jitter Testing
Latency Monitoring
MOS Monitoring
Packet Loss Monitoring
QoS Monitoring
Reporting / Analytics
Troubleshooting

Network Automation Features

Compliance Monitoring
Configuration Backup
Configuration Changes
Network Orchestration
Performance Monitoring
Tool Access Control
Vulnerability Assessments

Network Mapping Features

Color Codes / Icons
Compliance Management
Device Auto Discovery
Hierarchical Mapping
Location-Based Mapping
Map Exporting
On-Demand Mapping
Reporting/Analytics
Self-Updating Maps
Web Traffic Reporting

Network Security Features

Access Control
Analytics / Reporting
Compliance Reporting
Firewalls
Internet Usage Monitoring
Intrusion Detection System
Threat Response
VPN
Vulnerability Scanning

Network Traffic Analysis (NTA) Features

Anomalous Behavior Detection
High Bandwidth Usage Monitoring
Historical Behavior Data
Identify High Network Traffic Sources
Network Transaction Visibility
Stream Data to IDR or Data Lake
Traffic Decryption

Network Troubleshooting Features

Alerts / Escalation
Bandwidth Troubleshooting
Change Management
Configuration Management
Connectivity Management
Data Visualization
Historical Audit
Mobile Network Troubleshooting
Network Analysis
Network Monitoring

Server Management Features

CPU Monitoring
Credential Management
Database Servers
Email Monitoring
Event Logs
History Tracking
Patch Management
Scheduling
User Activity Monitoring
Virtual Machine Monitoring

Integrations

AlertOps
BackBox
BrightGauge
Check Point Infinity
Cisco FlexConnect
Cisco Meraki
DNSWatch
Dropbox
EcholoN
Ekara
Google Analytics
Google Drive
Link-Live
MIDAS
PagerTree
Parny
Qbilon
SMSEagle
ThreatSync
UVexplorer

Integrations

AlertOps
BackBox
BrightGauge
Check Point Infinity
Cisco FlexConnect
Cisco Meraki
DNSWatch
Dropbox
EcholoN
Ekara
Google Analytics
Google Drive
Link-Live
MIDAS
PagerTree
Parny
Qbilon
SMSEagle
ThreatSync
UVexplorer
Claim Paessler PRTG and update features and information