see is an R package that serves as the visualization component of the easystats ecosystem, providing plotting utilities to produce publication-ready visualizations of statistical model parameters, diagnostics, predictions, and performance metrics. It works in conjunction with other easystats packages (such as parameters, performance, modelbased, bayestestR, etc.) to convert model outputs or summary objects into visual forms (dot-and-whisker plots, diagnostic plots, residual plots, etc.). It includes themes, scales, geoms for ggplot2, and custom color palettes to make visual summaries more informative and attractive.
Features
- Plot parameter estimates with confidence intervals or credible intervals using “dot-and-whisker” style plots
- Diagnostic plots for model assumptions: residual normality, homoscedasticity, etc. via performance or similar upstream packages passed through see to plot()
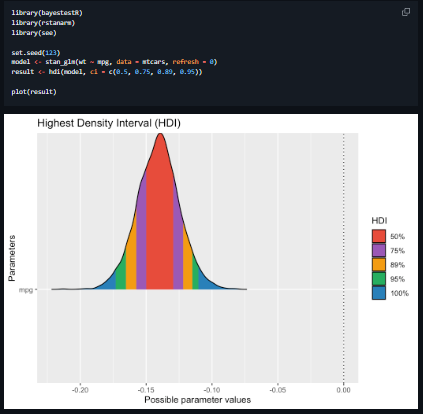
- Support for Bayesian model visualizations: highest density intervals (HDI), posterior distributions etc.
- Extra themes / color scales and geoms to enhance ggplot2 compatibility and aesthetics, including material design inspired color scales etc.
- Works with converted model summary objects from easystats packages (parameters, modelbased etc.) so that visualizations can be seamless with upstream analysis objects
- Ability to customize plots via ggplot2 layering (add titles, modify themes, combine plots etc.) thanks to returning ggplot2 objects
Project Samples

Categories
Data VisualizationLicense
MIT LicenseFollow see
Other Useful Business Software
Build Agents and Models on One Platform
Gemini Enterprise Agent Platform is Google Cloud's comprehensive platform for developers to build, scale, govern, and optimize agents and models. Choose from Google's most advanced models and third-party models like Anthropic's Claude Model Family.
Rate This Project
Login To Rate This Project
User Reviews
Be the first to post a review of see!
