Msc-generator Wiki
Draws signalling charts, block diagrams and graphs from text input.
Brought to you by:
teknos293
A tool to draw Message Sequence Charts for telecommunication applications from textual description.
The user manual is available in HTML and PDF. Doxygen documentation for the code is here.
For Bookworm/Jammy and later
Use the official repositories:
% apt install msc-generator[-doc|-nox]
-nox is a no-GUI build, starting with Debian Bookworm and Ubuntu Kinetic.
For Bionic to Impish
% apt install software-properties-common
% add-apt-repository ppa:homar/ppa
% apt install msc-generator
Up to Artful
% echo deb http://ppa.launchpad.net/homar/ppa/ubuntu <your_release_here> main | sudo tee /etc/apt/sources.list.d/homar-ppa.list
% sudo apt-key adv --keyserver keyserver.ubuntu.com --recv-keys A95ACB09
% sudo apt update
% sudo apt install msc-generator

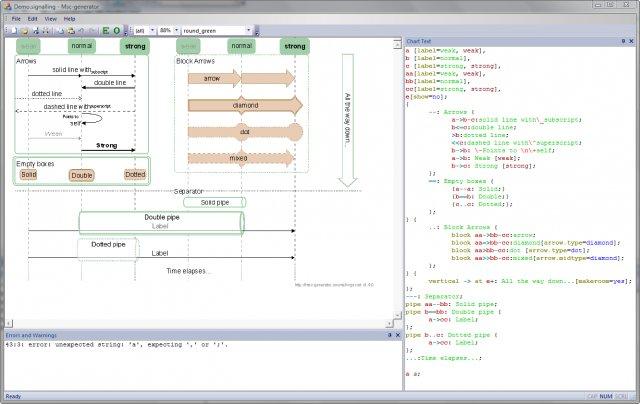

On Linux, Mac (but also on Windows) a full fledged editor GUI appears with
% msc-gen --gui
It has a built-in editor with color-syntax highlighting, syntax hints, smart indent, automatic compilation and more. On Windows it cannot edit charts embedded as an OLE object, but it can embed the chart text in a PNG file (on all platforms).
A simplistic Linux GTK GUI editor is available at the same repository with
% sudo apt install maggot
% maggot
All it has now is a very simple text editor pane with color syntax highlighting, a preview of the resulting chart, and exporting function to PNG files with the MSC source code embedded.
