Menu
▾
▴
Re: [Matplotlib-users] Filling area with a color like in an integral
|
From: Francesco M. <fra...@gm...> - 2012-10-16 14:09:34
|
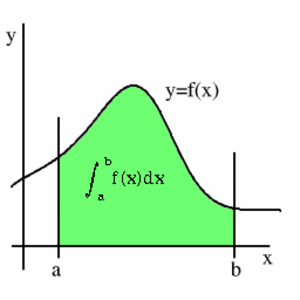
Hi 2012/10/16 ra...@0x... <ra...@0x...> > hi, > > I have a coordination system with some plotted dots connected with a > line. Now I'd like to fill up the whole space between the line and the > x-axis. It is the same as in a integral calculation: > http://www.definicionabc.com/wp-content/uploads/Integral.png > What I want to do is the same as the green color in the linked picture. > Give a look at fill_between. In the link you can find a demo http://matplotlib.org/examples/pylab_examples/fill_between_demo.html About the color, if you have the RGB color of the green you can pass it to fill_between. Is there a way to achieve that with matplotlib? > > thank you > Cheers > > > ------------------------------------------------------------------------------ > Don't let slow site performance ruin your business. Deploy New Relic APM > Deploy New Relic app performance management and know exactly > what is happening inside your Ruby, Python, PHP, Java, and .NET app > Try New Relic at no cost today and get our sweet Data Nerd shirt too! > http://p.sf.net/sfu/newrelic-dev2dev > _______________________________________________ > Matplotlib-users mailing list > Mat...@li... > https://lists.sourceforge.net/lists/listinfo/matplotlib-users > |