Menu
▾
▴
Re: [Matplotlib-users] Setting tick colors on a Polar plot for a circumplex
|
From: Paul I. <piv...@gm...> - 2011-01-11 08:53:50
|
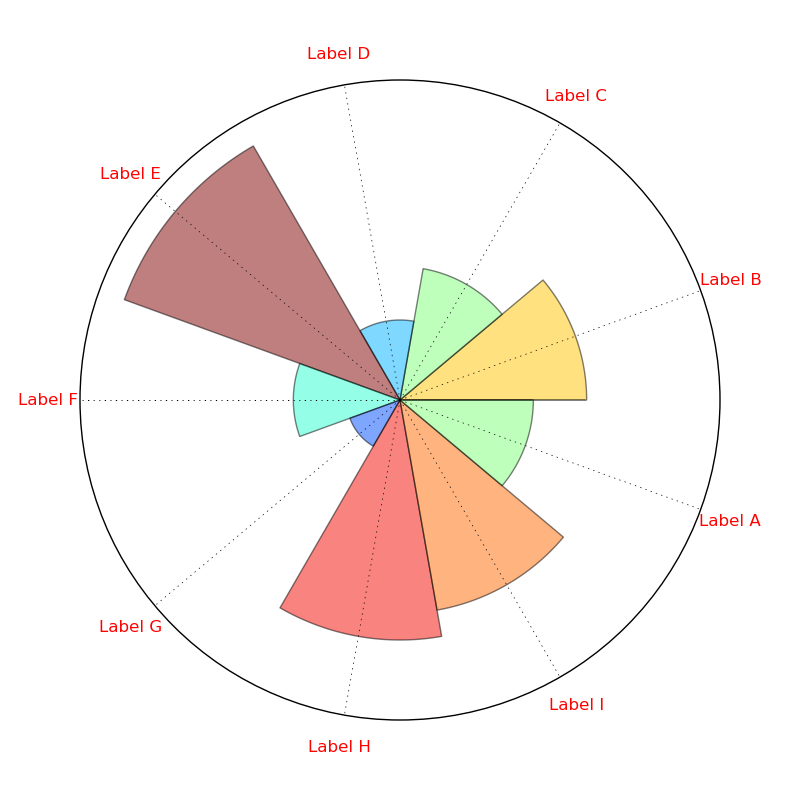
Damien Bathory, on 2011-01-11 15:27, wrote: > Hi All. > ... > I want to change the color of the ticklines set by set_thetagrids(), but I > am not having any luck. > ( See black instead of green ticklines here: > http://i1234.photobucket.com/albums/ff405/dbathory/circum.png ) > > Should I be able manipulating the ticklines in this way after calling > set_theagrids? > > for line in ax.xaxis.get_ticklines(): > line.set_color('g') > > I've also tried using the tick_params() call to set the default tickline > color, with no luck. > I've tried this on matplotlib v1.00 and v98.1, with the same results (black > instead of green). Hi Damien, Those aren't ticks, those are grid lines (verify by pressing 'g' after selecting the axes to toggle the grid on and off). ax.grid(color='green') is what you can use to set the grid line color (and other aspects, like linewidth, linestyle, alpha, etc). hope that helps, -- Paul Ivanov 314 address only used for lists, off-list direct email at: http://pirsquared.org | GPG/PGP key id: 0x0F3E28F7 |
