Menu
▾
▴
matplotlib-users
|
From: K.KISHIMOTO <ko...@us...> - 2003-12-12 07:49:20
|
Hi, I'm using matplotlib for my scientific analysis, and charmed by It's function. Because I often use another tools for data histograming, I think it's convenient if matplotlib could plot already histogramed data more efficiently. For exmple, changing from hist(x, bins=10, noplot=0, normed=0) to hist(x, bins=10, noplot=0, normed=0, weights=[], errors=[]) Calling hist([0.5, 1.5, 1.7, 2.5], [0.0, 1.0, 3.0]) equals to hist([0.5, 1.6, 2.5], [0.0, 1.0, 3.0], weights=[1.0, 2.0, 0.0]) or hist([0.5, 1.6, 2.5], [0.0, 1.0, 3.0], weights=[1.0, 2.0, 0.0], errors=[1.0, 1.414, 0.0]) (1) When "weights" argument is provided, "x" is assumed as a list of weighted mean (or center) values of each bin and "weights" is assumed as a list of (already histogramed) weights of each bin. (2) When "errors" argument is omitted, it's default values are set to the squares of weights. (3) When "errors" argument is provided, it's values are used as a list of one-sigma errors of each bin. Thank you for reading. Koji |
|
From: John H. <jdh...@ac...> - 2003-12-12 13:38:55
|
>>>>> "K" == K KISHIMOTO <ko...@us...> writes:

    K> Hi, I'm using matplotlib for my scientific analysis, and
    K> charmed by It's function.

Thanks!

    K> Because I often use another tools for data histograming, I
    K> think it's convenient if matplotlib could plot already
    K> histogramed data more efficiently.

This seems like the kind of thing that would best be done in your user
library.  Eg, if you make a module mymatplotlib.py, you can defined
your own hist.  In that file, just import matplotlib.matlab and call
matplotlib.matlab.hist within it.  In fact, matplotlib.matlab.hist
calls matplotlib.mlab.hist.

On an unrelated topic:

  def hist(x, bins=10, noplot=0, normed=0, weights=[], errors=[])

Just wanted to point out that this is a potential gotcha in python.
For example, what do you expect the output of this code to be?

def func1(x=[]):
    if not len(x): x.append(1)
    print x

def func2(y=[]):
    if len(y)<2: y.append(2)
    print y

z = []
func1(z)
func2(z)

The standard way to pass empty lists as default function args is to
do:

def func1(x=None):
    if x is None: x = []
    #blah blah

Lists and dicts are different in this capacity than strings or ints
because the can be changed (mutable).

Thanks for your suggestions,
John Hunter
|
|
From: K. K. <ko...@us...> - 2003-12-15 13:38:29
|
Thank you for your reply.

> def func1(x=None):
>     if x is None: x = []
>     #blah blah

The indication is right.
I should have done so. Thank you.

> This seems like the kind of thing that would best be done in your user
> library.  Eg, if you make a module mymatplotlib.py, you can defined
> your own hist.  In that file, just import matplotlib.matlab and call
> matplotlib.matlab.hist within it.  In fact, matplotlib.matlab.hist
> calls matplotlib.mlab.hist.

I am sorry that my last explanation was insufficient.
The point is that I think it is inefficient to execute the following
two lines in matplotlib.mlab.hist when I know the result of "n" already.
 >> n = searchsorted(sort(y), bins)
 >> n = diff(concatenate([n, [len(y)]]))

For the moment, I must insert extra code
 >> y = [1.0] * 1000
(and hist(y, [0.0, 2.0]) calculates n = [1000], then plot the data.)
This is very expensive.

Another point is hist() does not support error bar plot (but bar()
called from hist() does support.)

So, I propose again
def hist(x, bins=10, noplot=0, normed=0, weights=None, errors=None ,
**kwargs):
in matplotlib.matplab.
I think if matplotlib supports this by default, it is very smart and
usefull to many users when making histogram plots with matplotlib than
letting hist() be mainly for the purpose of "calculating" histograms.

Example rough code.
------
def hist(x, bins=10, noplot=0, normed=0, weights=None, xerr=None,
yerr=None, **kwargs):
    if noplot:
       if weights == None:
          return mlab.hist(x, bins, normed)
       else:
          return (weights, bins)
    else:
       try:
          if weights == None:
             ret = gca().hist(x, bins, normed)
          else:
             ret = gca().bar(bins, weights, xerr=xerr, yerr=yerr,
**kwargs)
       except ValueError, msg:
          msg = raise_msg_to_str(msg)
          error_msg(msg)
          raise RuntimeError, msg
    draw_if_interactive()
    return ret
|
|
From: John H. <jdh...@ac...> - 2003-12-15 14:16:56
|
>>>>> "K" == K KISHIMOTO <ko...@us...> writes:

    K> I am sorry that my last explanation was insufficient.  The
    K> point is that I think it is inefficient to execute the
    K> following two lines in matplotlib.mlab.hist when I know the
    K> result of "n" already.

Good point ...

    K> Another point is hist() does not support error bar plot (but
    K> bar() called from hist() does support.)

Another good point....

    K> So, I propose again def hist(x, bins=10, noplot=0, normed=0,
    K> weights=None, errors=None , **kwargs): in matplotlib.matplab.
    K> I think if matplotlib supports this by default, it is very
    K> smart and usefull to many users when making histogram plots
    K> with matplotlib than letting hist() be mainly for the purpose
    K> of "calculating" histograms.

OK, I'll give it some thought.  Sounds reasonable enough.  It doesn't
break backwards compatibility, adds useful features, and is more
consistent with bar.

JDH
|
|
From: K.KISHIMOTO <ko...@us...> - 2003-12-16 08:36:09
|
Hi, On 2003.12.15, at 23:09 Japan, John Hunter wrote: > OK, I'll give it some thought. Sounds reasonable enough. It doesn't > break backwards compatibility, adds useful features, and is more > consistent with bar. Thank you so much! If possible, I think it is nice for matplotlib to be able to plot histograms by not only bars but also lines. My meaning of "bar histogram plotting" is like the bottom-left plot in http://jas.freehep.org/images/screenshots/gui2.gif and "line histogram plotting" is like the others. There are two reasons. (1) Because one bin width becomes a few pixcels, it is hard to see when the number of bins is about a few thousand in the bar histogram plotting mode. (2) The color of all of the data filled area become the same by using bar and one can specify the line color separately. This brings smart view when multiple histograms are plotted like in http://root.cern.ch/root/html/examples/gif/hsum.gif Off course, the bar histogram plotting is more smart in one case, but in another case the line is better. In addition, the support of both bar and line histogram plotting will matplotlib to be able to have more plotting features that the colors of line and filled area can be specified separately by the user. It seems that it is relatively not difficult to implement the feature by connecting points of [(x0, 0), (x0, y0), (x1, y0), (x1, y1), (x2, y1), (x2, y2), ...(and so on)] and will also not break backwards compatibility. If possible, please give a consideration to this. >>>>>> "K" == K KISHIMOTO <ko...@us...> writes: > > K> I am sorry that my last explanation was insufficient. The > K> point is that I think it is inefficient to execute the > K> following two lines in matplotlib.mlab.hist when I know the > K> result of "n" already. > > Good point ... > > K> Another point is hist() does not support error bar plot (but > K> bar() called from hist() does support.) > > Another good point.... > > K> So, I propose again def hist(x, bins=10, noplot=0, normed=0, > K> weights=None, errors=None , **kwargs): in matplotlib.matplab. > K> I think if matplotlib supports this by default, it is very > K> smart and usefull to many users when making histogram plots > K> with matplotlib than letting hist() be mainly for the purpose > K> of "calculating" histograms. > > OK, I'll give it some thought. Sounds reasonable enough. It doesn't > break backwards compatibility, adds useful features, and is more > consistent with bar. > > JDH > |
|
From: John H. <jdh...@ac...> - 2003-12-16 11:55:06
|
>>>>> "K" == K KISHIMOTO <ko...@us...> writes:

    K> If possible, I think it is nice for matplotlib to be able to
    K> plot histograms by not only bars but also lines.  My meaning of
    K> "bar histogram plotting" is like the bottom-left plot in
    K> http://jas.freehep.org/images/screenshots/gui2.gif and "line
    K> histogram plotting" is like the others.  There are two reasons.

If I understand you correctly, and from looking at the images you
linked to, all you need to do is set the edge and face properties of
the bars to the same color.  The default edge color is black and the
default face color is blue, so if you want a solid histogram do

    from matplotlib.matlab import *

    mu, sigma = 100, 15
    x = mu + sigma*randn(10000)

    n, bins, patches = hist(x, 200, normed=1)
    set(patches, 'edgecolor', 'b')
    show()

Is this what you mean?

    K> Off course, the bar histogram plotting is more smart in one
    K> case, but in another case the line is better.  In addition, the
    K> support of both bar and line histogram plotting will matplotlib
    K> to be able to have more plotting features that the colors of
    K> line and filled area can be specified separately by the user.

The axes function 'vlines' plots vertical lines.  See the
example/vline_demo.py

Cheers,
John Hunter
|
|
From: K.KISHIMOTO <ko...@us...> - 2003-12-16 12:48:07
|
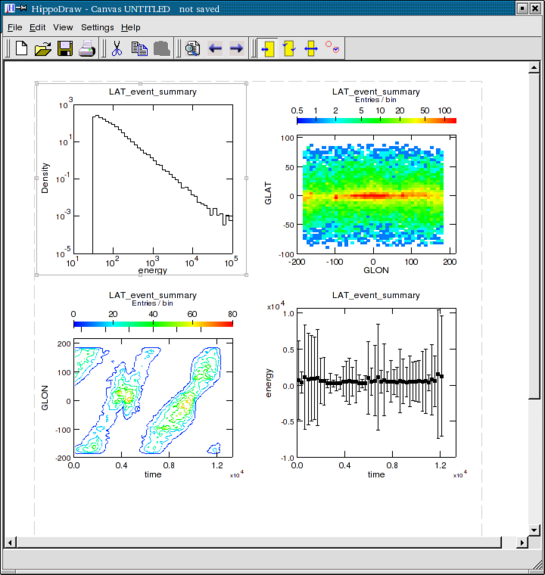
Thanks for your quick reply. On 2003.12.16, at 20:47 Japan, John Hunter wrote: > Is this what you mean? More precisely, what I mean is like the top-left plot in http://www.slac.stanford.edu/grp/ek/hippodraw/canvaswindow.png If I understand bar() (then hist()) functionalities correctly, it may be unable to create such a plot currently without using plot(). from matplotlib.matlab import * bins = [0, 1, 2, 3] vals = [3, 4, 5] x = [bins[0]] y = [0] vals.append(0) for i in range(len(bins) - 1): x.append(bins[i]) y.append(vals[i]) x.append(bins[i + 1]) y.append(vals[i]) x.append(bins[i + 1]) y.append(vals[i + 1]) plot(x, y) show() |
×

Want the latest updates on software, tech news, and AI?
Get latest updates about software, tech news, and AI from SourceForge directly in your inbox once a month.
Thanks for helping keep SourceForge clean.
X