
Menu
▾
▴
matplotlib-users — Discussion related to using matplotlib
You can subscribe to this list here.
| 2003 |
Jan
|
Feb
|
Mar
|
Apr
|
May
(3) |
Jun
|
Jul
|
Aug
(12) |
Sep
(12) |
Oct
(56) |
Nov
(65) |
Dec
(37) |
|---|---|---|---|---|---|---|---|---|---|---|---|---|
| 2004 |
Jan
(59) |
Feb
(78) |
Mar
(153) |
Apr
(205) |
May
(184) |
Jun
(123) |
Jul
(171) |
Aug
(156) |
Sep
(190) |
Oct
(120) |
Nov
(154) |
Dec
(223) |
| 2005 |
Jan
(184) |
Feb
(267) |
Mar
(214) |
Apr
(286) |
May
(320) |
Jun
(299) |
Jul
(348) |
Aug
(283) |
Sep
(355) |
Oct
(293) |
Nov
(232) |
Dec
(203) |
| 2006 |
Jan
(352) |
Feb
(358) |
Mar
(403) |
Apr
(313) |
May
(165) |
Jun
(281) |
Jul
(316) |
Aug
(228) |
Sep
(279) |
Oct
(243) |
Nov
(315) |
Dec
(345) |
| 2007 |
Jan
(260) |
Feb
(323) |
Mar
(340) |
Apr
(319) |
May
(290) |
Jun
(296) |
Jul
(221) |
Aug
(292) |
Sep
(242) |
Oct
(248) |
Nov
(242) |
Dec
(332) |
| 2008 |
Jan
(312) |
Feb
(359) |
Mar
(454) |
Apr
(287) |
May
(340) |
Jun
(450) |
Jul
(403) |
Aug
(324) |
Sep
(349) |
Oct
(385) |
Nov
(363) |
Dec
(437) |
| 2009 |
Jan
(500) |
Feb
(301) |
Mar
(409) |
Apr
(486) |
May
(545) |
Jun
(391) |
Jul
(518) |
Aug
(497) |
Sep
(492) |
Oct
(429) |
Nov
(357) |
Dec
(310) |
| 2010 |
Jan
(371) |
Feb
(657) |
Mar
(519) |
Apr
(432) |
May
(312) |
Jun
(416) |
Jul
(477) |
Aug
(386) |
Sep
(419) |
Oct
(435) |
Nov
(320) |
Dec
(202) |
| 2011 |
Jan
(321) |
Feb
(413) |
Mar
(299) |
Apr
(215) |
May
(284) |
Jun
(203) |
Jul
(207) |
Aug
(314) |
Sep
(321) |
Oct
(259) |
Nov
(347) |
Dec
(209) |
| 2012 |
Jan
(322) |
Feb
(414) |
Mar
(377) |
Apr
(179) |
May
(173) |
Jun
(234) |
Jul
(295) |
Aug
(239) |
Sep
(276) |
Oct
(355) |
Nov
(144) |
Dec
(108) |
| 2013 |
Jan
(170) |
Feb
(89) |
Mar
(204) |
Apr
(133) |
May
(142) |
Jun
(89) |
Jul
(160) |
Aug
(180) |
Sep
(69) |
Oct
(136) |
Nov
(83) |
Dec
(32) |
| 2014 |
Jan
(71) |
Feb
(90) |
Mar
(161) |
Apr
(117) |
May
(78) |
Jun
(94) |
Jul
(60) |
Aug
(83) |
Sep
(102) |
Oct
(132) |
Nov
(154) |
Dec
(96) |
| 2015 |
Jan
(45) |
Feb
(138) |
Mar
(176) |
Apr
(132) |
May
(119) |
Jun
(124) |
Jul
(77) |
Aug
(31) |
Sep
(34) |
Oct
(22) |
Nov
(23) |
Dec
(9) |
| 2016 |
Jan
(26) |
Feb
(17) |
Mar
(10) |
Apr
(8) |
May
(4) |
Jun
(8) |
Jul
(6) |
Aug
(5) |
Sep
(9) |
Oct
(4) |
Nov
|
Dec
|
| 2017 |
Jan
(5) |
Feb
(7) |
Mar
(1) |
Apr
(5) |
May
|
Jun
(3) |
Jul
(6) |
Aug
(1) |
Sep
|
Oct
(2) |
Nov
(1) |
Dec
|
| 2018 |
Jan
|
Feb
|
Mar
|
Apr
(1) |
May
|
Jun
|
Jul
|
Aug
|
Sep
|
Oct
|
Nov
|
Dec
|
| 2020 |
Jan
|
Feb
|
Mar
|
Apr
|
May
(1) |
Jun
|
Jul
|
Aug
|
Sep
|
Oct
|
Nov
|
Dec
|
| 2025 |
Jan
(1) |
Feb
|
Mar
|
Apr
|
May
|
Jun
|
Jul
|
Aug
|
Sep
|
Oct
|
Nov
|
Dec
|
|
From: Rich S. <rsi...@us...> - 2012-10-16 17:20:15
|
Jeff, Yep, that worked! So here is a working example of OWSlib with Basemap: http://nbviewer.ipython.org/3900648/ I switched the Basemap projection to 'cyl' because we need to ensure that Basemap and WMS are using the same projection, right? (and since I had requested EPSG:4326 from WMS, that's the 'cyl' in Basemap). Thanks! Rich On Tue, Oct 16, 2012 at 11:38 AM, Jeff Whitaker <js...@fa...> wrote: > On 10/16/12 8:48 AM, Rich Signell wrote: >> >> Klo & Jeff, >> >> I tried making a concrete example of using OWSlib with Basemap, but >> althought the WMS image looks good, the warpimage does not. >> >> http://nbviewer.ipython.org/3899690/ >> >> Do you see where I went wrong? >> >> Thanks, >> Rich > > > Rich: warpimage assumes the image is of global extent. In your example, I > think you can just pass the image to the basemap imshow method with > > from matplotlib.image import imread > import urllib2 > m.imshow(imread(urllib2.urlopen(url)),origin='upper') > > Klo previously mentioned there might be a problem with the png data from the > WMS server being 'chunked', s you might have to use klo's imshow_chunked > function > > http://www.mail-archive.com/mat...@li.../msg25618.html > > > -Jeff > >> >> On Sat, Oct 13, 2012 at 7:26 PM, klo uo <kl...@gm...> wrote: >>> >>> That's also what that snippet I linked does. You can add it to to Basemap >>> and it should work. >>> >>> However Jeff suggested we use this tiny package OWSlib and handle WMS >>> that >>> way, which is better IMHO, but for some reason we did not got further >>> reply. >>> >>> >>> >>> On Fri, Oct 12, 2012 at 1:31 PM, Rich Signell <rsi...@us...> wrote: >>>> >>>> WMS services are required to respond to "GetCapabiltiies" request, >>>> reporting what layers, styles, times, elevations, and projections they >>>> have available. So for example, using the Unidata WMS example below, >>>> if we do: >>>> >>>> >>>> >>>> http://motherlode.ucar.edu:8080/thredds/wms/fmrc/NCEP/NAM/CONUS_12km/NCEP-NAM-CONUS_12km-noaaport_best.ncd?service=WMS&request=GetCapabilities >>>> >>>> we can see from the XML response that the Coordinate Reference Systems >>>> supported are: >>>> >>>> <CRS>EPSG:4326</CRS> >>>> <CRS>CRS:84</CRS> >>>> <CRS>EPSG:41001</CRS> >>>> <CRS>EPSG:3857</CRS> >>>> <CRS>EPSG:27700</CRS> >>>> <CRS>EPSG:3408</CRS> >>>> <CRS>EPSG:3409</CRS> >>>> <CRS>EPSG:32661</CRS> >>>> <CRS>EPSG:32761</CRS> >>>> >>>> And for this server, the supported response types are: >>>> <Format>image/jpeg</Format> >>>> <Format>image/png</Format> >>>> <Format>application/vnd.google-earth.kmz</Format> >>>> <Format>image/gif</Format> >>>> >>>> So I guess one way to proceed if you wanted to use WMS in Matplotlib >>>> and avoid reprojection in python would be to: >>>> 1. do the WMS GetCapabilities request to find the available supported >>>> Coordinate Reference Systems (which will vary with WMS server) >>>> 2. setup Basemap to use one of these CRS >>>> 3. use the bounding box of your current axis (in projection units) as >>>> part of a GetMap request to the WMS. >>>> >>>> -Rich >>>> >>>> On Thu, Oct 11, 2012 at 12:16 AM, klo uo <kl...@gm...> wrote: >>>>> >>>>> I guess that's it? >>>>> >>>>> warpimage() as it is now, checks if passed image is url, so we can add >>>>> additional check if image is url, with urlparse to deduce image >>>>> coordinates >>>>> and projection if present, then overlay it over already created Basemap >>>>> object. >>>>> >>>>> >>>>> >>>>> ------------------------------------------------------------------------------ >>>>> Don't let slow site performance ruin your business. Deploy New Relic >>>>> APM >>>>> Deploy New Relic app performance management and know exactly >>>>> what is happening inside your Ruby, Python, PHP, Java, and .NET app >>>>> Try New Relic at no cost today and get our sweet Data Nerd shirt too! >>>>> http://p.sf.net/sfu/newrelic-dev2dev >>>>> _______________________________________________ >>>>> Matplotlib-users mailing list >>>>> Mat...@li... >>>>> https://lists.sourceforge.net/lists/listinfo/matplotlib-users >>>>> >>>> >>>> >>>> -- >>>> Dr. Richard P. Signell (508) 457-2229 >>>> USGS, 384 Woods Hole Rd. >>>> Woods Hole, MA 02543-1598 >>> >>> >> >> > -- Dr. Richard P. Signell (508) 457-2229 USGS, 384 Woods Hole Rd. Woods Hole, MA 02543-1598 |
|
From: Benjamin R. <ben...@ou...> - 2012-10-16 16:15:32
|
On Tue, Oct 16, 2012 at 11:25 AM, hari jayaram <ha...@gm...> wrote:

> Hi
> I am a relative newbie to matplotlib.
>
> I have a python script that handles a dataset that comprises 384 sets of
> data.
>
> At the present moment , I read in a set of data - process it - and the
> create a figure using code shown below.
> I am using windows with the default backend ( I think I set it to wx).
>
> When I run the program, figure after figure shows up..the program
> continues from well to well plotting the figure. I can close the figure
> window using the X on the right -hand side..while the program chugs along.
>
> Is there a way to just recycle the figure object , so that the plot shows
> up for a brief second and refreshes when the next calculation is complete.
> Each process_data function , takes a few minutes.
>
> Alternatively I just want to close the figure object I show after a brief
> lag.  I am OK if that happens instantaneously..but I dont know how
> to achieve this.
> Do I have to use the matplotlib.Figure object to achieve this functionality
>
> Thanks
> Hari
>
>
>
Hari,

To recycle the figure, try the following:


import matplotlib.pyplot as plt

def do_my_plot(par1, par2, well_id):
    processed_data_object = processed_dict[well_id]
    # Plot all the data
    par1.plot(processed_data_object.raw_x,processed_data_object.raw_y).
    par2.plot(....
    # finally
    plt.show()
    # I tried  fig.clf()


def plot_and_process_data():
    plt.ion()  # Turn on interactive mode
    fig = plt.figure(figsize=(7,7)
    ax = fig.add_subplot(1,1,1)
    par1 =ax.twinx()
    par2 = ax.twinx()

    for well_id in list_of_384_well_ids:
         par1.cla()
         par2.cla()
         process_data(well_id)
         do_my_plot(par1, par2, well_id)

Note, this is completely untested, but it would be how I would go about it
at first.  The "plt.ion()" turns on interactive mode to allow your code to
continue running even after the plot window appears (but does not end until
the last window is closed.).  Of course, another approach would simply be
to do "fig.savefig()" after every update to the figure and never use show()
and ion() (essentially, a non-interactive head-less script).

Hopefully, this helps.
Ben Root
|
|
From: Damon M. <dam...@gm...> - 2012-10-16 16:13:57
|
On Tue, Oct 16, 2012 at 5:09 PM, Sterling Smith <sm...@fu...> wrote: > Hari, > > You can give a number to figure(), as in figure(1), and it will reuse figure 1. Also, you can close figure 1 with pyplot.close(1). > > -Sterling > > On Oct 16, 2012, at 8:25AM, hari jayaram wrote: > >> Hi >> I am a relative newbie to matplotlib. >> >> I have a python script that handles a dataset that comprises 384 sets of data. >> >> At the present moment , I read in a set of data - process it - and the create a figure using code shown below. >> I am using windows with the default backend ( I think I set it to wx). >> >> When I run the program, figure after figure shows up..the program continues from well to well plotting the figure. I can close the figure window using the X on the right -hand side..while the program chugs along. >> >> Is there a way to just recycle the figure object , so that the plot shows up for a brief second and refreshes when the next calculation is complete. Each process_data function , takes a few minutes. >> >> Alternatively I just want to close the figure object I show after a brief lag. I am OK if that happens instantaneously..but I dont know how to achieve this. >> Do I have to use the matplotlib.Figure object to achieve this functionality >> >> Thanks >> Hari >> >> >> >> >> >> from matplotlib.pyplot import figure >> >> def do_my_plot(well_id): >> processed_data_object = processed_dict[well_id] >> fig = figure(figsize=(7,7) >> ax = fig.add_subplot(1,1,1) >> par1 =ax.twinx() >> par2 = ax.twinx() >> # Plot all the data >> par1.plot(processed_data_object.raw_x,processed_data_object.raw_y). >> par2.plot(.... >> # finally >> fig.show() >> # I tried fig.clf() >> >> >> def plot_and_process_data(): >> for well_id in list_of_384_well_ids: >> process_data(well_id) >> do_my_plot(well_id) Or you can call ax.cla() to clear the axes before plotting the next data set. Then subsequent calls to plot don't need 300+ figure objects. -- Damon McDougall http://www.damon-is-a-geek.com B2.39 Mathematics Institute University of Warwick Coventry West Midlands CV4 7AL United Kingdom |
|
From: Sterling S. <sm...@fu...> - 2012-10-16 16:10:19
|
Hari, You can give a number to figure(), as in figure(1), and it will reuse figure 1. Also, you can close figure 1 with pyplot.close(1). -Sterling On Oct 16, 2012, at 8:25AM, hari jayaram wrote: > Hi > I am a relative newbie to matplotlib. > > I have a python script that handles a dataset that comprises 384 sets of data. > > At the present moment , I read in a set of data - process it - and the create a figure using code shown below. > I am using windows with the default backend ( I think I set it to wx). > > When I run the program, figure after figure shows up..the program continues from well to well plotting the figure. I can close the figure window using the X on the right -hand side..while the program chugs along. > > Is there a way to just recycle the figure object , so that the plot shows up for a brief second and refreshes when the next calculation is complete. Each process_data function , takes a few minutes. > > Alternatively I just want to close the figure object I show after a brief lag. I am OK if that happens instantaneously..but I dont know how to achieve this. > Do I have to use the matplotlib.Figure object to achieve this functionality > > Thanks > Hari > > > > > > from matplotlib.pyplot import figure > > def do_my_plot(well_id): > processed_data_object = processed_dict[well_id] > fig = figure(figsize=(7,7) > ax = fig.add_subplot(1,1,1) > par1 =ax.twinx() > par2 = ax.twinx() > # Plot all the data > par1.plot(processed_data_object.raw_x,processed_data_object.raw_y). > par2.plot(.... > # finally > fig.show() > # I tried fig.clf() > > > def plot_and_process_data(): > for well_id in list_of_384_well_ids: > process_data(well_id) > do_my_plot(well_id) > > > > > > > > > > > > ------------------------------------------------------------------------------ > Don't let slow site performance ruin your business. Deploy New Relic APM > Deploy New Relic app performance management and know exactly > what is happening inside your Ruby, Python, PHP, Java, and .NET app > Try New Relic at no cost today and get our sweet Data Nerd shirt too! > http://p.sf.net/sfu/newrelic-dev2dev_______________________________________________ > Matplotlib-users mailing list > Mat...@li... > https://lists.sourceforge.net/lists/listinfo/matplotlib-users |
|
From: Jeff W. <js...@fa...> - 2012-10-16 15:44:03
|
On 10/16/12 8:48 AM, Rich Signell wrote: > Klo & Jeff, > > I tried making a concrete example of using OWSlib with Basemap, but > althought the WMS image looks good, the warpimage does not. > > http://nbviewer.ipython.org/3899690/ > > Do you see where I went wrong? > > Thanks, > Rich Rich: warpimage assumes the image is of global extent. In your example, I think you can just pass the image to the basemap imshow method with from matplotlib.image import imread import urllib2 m.imshow(imread(urllib2.urlopen(url)),origin='upper') Klo previously mentioned there might be a problem with the png data from the WMS server being 'chunked', s you might have to use klo's imshow_chunked function http://www.mail-archive.com/mat...@li.../msg25618.html -Jeff > > On Sat, Oct 13, 2012 at 7:26 PM, klo uo <kl...@gm...> wrote: >> That's also what that snippet I linked does. You can add it to to Basemap >> and it should work. >> >> However Jeff suggested we use this tiny package OWSlib and handle WMS that >> way, which is better IMHO, but for some reason we did not got further reply. >> >> >> >> On Fri, Oct 12, 2012 at 1:31 PM, Rich Signell <rsi...@us...> wrote: >>> WMS services are required to respond to "GetCapabiltiies" request, >>> reporting what layers, styles, times, elevations, and projections they >>> have available. So for example, using the Unidata WMS example below, >>> if we do: >>> >>> >>> http://motherlode.ucar.edu:8080/thredds/wms/fmrc/NCEP/NAM/CONUS_12km/NCEP-NAM-CONUS_12km-noaaport_best.ncd?service=WMS&request=GetCapabilities >>> >>> we can see from the XML response that the Coordinate Reference Systems >>> supported are: >>> >>> <CRS>EPSG:4326</CRS> >>> <CRS>CRS:84</CRS> >>> <CRS>EPSG:41001</CRS> >>> <CRS>EPSG:3857</CRS> >>> <CRS>EPSG:27700</CRS> >>> <CRS>EPSG:3408</CRS> >>> <CRS>EPSG:3409</CRS> >>> <CRS>EPSG:32661</CRS> >>> <CRS>EPSG:32761</CRS> >>> >>> And for this server, the supported response types are: >>> <Format>image/jpeg</Format> >>> <Format>image/png</Format> >>> <Format>application/vnd.google-earth.kmz</Format> >>> <Format>image/gif</Format> >>> >>> So I guess one way to proceed if you wanted to use WMS in Matplotlib >>> and avoid reprojection in python would be to: >>> 1. do the WMS GetCapabilities request to find the available supported >>> Coordinate Reference Systems (which will vary with WMS server) >>> 2. setup Basemap to use one of these CRS >>> 3. use the bounding box of your current axis (in projection units) as >>> part of a GetMap request to the WMS. >>> >>> -Rich >>> >>> On Thu, Oct 11, 2012 at 12:16 AM, klo uo <kl...@gm...> wrote: >>>> I guess that's it? >>>> >>>> warpimage() as it is now, checks if passed image is url, so we can add >>>> additional check if image is url, with urlparse to deduce image >>>> coordinates >>>> and projection if present, then overlay it over already created Basemap >>>> object. >>>> >>>> >>>> ------------------------------------------------------------------------------ >>>> Don't let slow site performance ruin your business. Deploy New Relic APM >>>> Deploy New Relic app performance management and know exactly >>>> what is happening inside your Ruby, Python, PHP, Java, and .NET app >>>> Try New Relic at no cost today and get our sweet Data Nerd shirt too! >>>> http://p.sf.net/sfu/newrelic-dev2dev >>>> _______________________________________________ >>>> Matplotlib-users mailing list >>>> Mat...@li... >>>> https://lists.sourceforge.net/lists/listinfo/matplotlib-users >>>> >>> >>> >>> -- >>> Dr. Richard P. Signell (508) 457-2229 >>> USGS, 384 Woods Hole Rd. >>> Woods Hole, MA 02543-1598 >> > > |
|
From: hari j. <ha...@gm...> - 2012-10-16 15:26:01
|
Hi
I am a relative newbie to matplotlib.

I have a python script that handles a dataset that comprises 384 sets of
data.

At the present moment , I read in a set of data - process it - and the
create a figure using code shown below.
I am using windows with the default backend ( I think I set it to wx).

When I run the program, figure after figure shows up..the program continues
from well to well plotting the figure. I can close the figure window using
the X on the right -hand side..while the program chugs along.

Is there a way to just recycle the figure object , so that the plot shows
up for a brief second and refreshes when the next calculation is complete.
Each process_data function , takes a few minutes.

Alternatively I just want to close the figure object I show after a brief
lag.  I am OK if that happens instantaneously..but I dont know how
to achieve this.
Do I have to use the matplotlib.Figure object to achieve this functionality

Thanks
Hari


from matplotlib.pyplot import figure

def do_my_plot(well_id):
    processed_data_object = processed_dict[well_id]
    fig = figure(figsize=(7,7)
    ax = fig.add_subplot(1,1,1)
    par1 =ax.twinx()
    par2 = ax.twinx()
    # Plot all the data
    par1.plot(processed_data_object.raw_x,processed_data_object.raw_y).
    par2.plot(....
    # finally
    fig.show()
    # I tried  fig.clf()


def plot_and_process_data():
    for well_id in list_of_384_well_ids:
         process_data(well_id)
         do_my_plot(well_id)
|
|
From: Rich S. <rsi...@us...> - 2012-10-16 14:48:33
|
Klo & Jeff, I tried making a concrete example of using OWSlib with Basemap, but althought the WMS image looks good, the warpimage does not. http://nbviewer.ipython.org/3899690/ Do you see where I went wrong? Thanks, Rich On Sat, Oct 13, 2012 at 7:26 PM, klo uo <kl...@gm...> wrote: > That's also what that snippet I linked does. You can add it to to Basemap > and it should work. > > However Jeff suggested we use this tiny package OWSlib and handle WMS that > way, which is better IMHO, but for some reason we did not got further reply. > > > > On Fri, Oct 12, 2012 at 1:31 PM, Rich Signell <rsi...@us...> wrote: >> >> WMS services are required to respond to "GetCapabiltiies" request, >> reporting what layers, styles, times, elevations, and projections they >> have available. So for example, using the Unidata WMS example below, >> if we do: >> >> >> http://motherlode.ucar.edu:8080/thredds/wms/fmrc/NCEP/NAM/CONUS_12km/NCEP-NAM-CONUS_12km-noaaport_best.ncd?service=WMS&request=GetCapabilities >> >> we can see from the XML response that the Coordinate Reference Systems >> supported are: >> >> <CRS>EPSG:4326</CRS> >> <CRS>CRS:84</CRS> >> <CRS>EPSG:41001</CRS> >> <CRS>EPSG:3857</CRS> >> <CRS>EPSG:27700</CRS> >> <CRS>EPSG:3408</CRS> >> <CRS>EPSG:3409</CRS> >> <CRS>EPSG:32661</CRS> >> <CRS>EPSG:32761</CRS> >> >> And for this server, the supported response types are: >> <Format>image/jpeg</Format> >> <Format>image/png</Format> >> <Format>application/vnd.google-earth.kmz</Format> >> <Format>image/gif</Format> >> >> So I guess one way to proceed if you wanted to use WMS in Matplotlib >> and avoid reprojection in python would be to: >> 1. do the WMS GetCapabilities request to find the available supported >> Coordinate Reference Systems (which will vary with WMS server) >> 2. setup Basemap to use one of these CRS >> 3. use the bounding box of your current axis (in projection units) as >> part of a GetMap request to the WMS. >> >> -Rich >> >> On Thu, Oct 11, 2012 at 12:16 AM, klo uo <kl...@gm...> wrote: >> > I guess that's it? >> > >> > warpimage() as it is now, checks if passed image is url, so we can add >> > additional check if image is url, with urlparse to deduce image >> > coordinates >> > and projection if present, then overlay it over already created Basemap >> > object. >> > >> > >> > ------------------------------------------------------------------------------ >> > Don't let slow site performance ruin your business. Deploy New Relic APM >> > Deploy New Relic app performance management and know exactly >> > what is happening inside your Ruby, Python, PHP, Java, and .NET app >> > Try New Relic at no cost today and get our sweet Data Nerd shirt too! >> > http://p.sf.net/sfu/newrelic-dev2dev >> > _______________________________________________ >> > Matplotlib-users mailing list >> > Mat...@li... >> > https://lists.sourceforge.net/lists/listinfo/matplotlib-users >> > >> >> >> >> -- >> Dr. Richard P. Signell (508) 457-2229 >> USGS, 384 Woods Hole Rd. >> Woods Hole, MA 02543-1598 > > -- Dr. Richard P. Signell (508) 457-2229 USGS, 384 Woods Hole Rd. Woods Hole, MA 02543-1598 |
|
From: Alejandro W. <ale...@gm...> - 2012-10-16 14:26:40
|
On Tue, Oct 16, 2012 at 8:03 AM, ra...@0x... <ra...@0x...> wrote: > Is there a way to achieve that with matplotlib? This example is very close to what you want: http://matplotlib.org/examples/pylab_examples/integral_demo.html |
|
From: Andreas H. <li...@hi...> - 2012-10-16 14:13:14
|
> I have a coordination system with some plotted dots connected with a > line. Now I'd like to fill up the whole space between the line and the > x-axis. It is the same as in a integral calculation: > http://www.definicionabc.com/wp-content/uploads/Integral.png > What I want to do is the same as the green color in the linked picture. You can find an example in the matplotlib gallery (http://matplotlib.org/gallery.html): http://matplotlib.org/examples/pylab_examples/fill_between_demo.html The function you're looking for is ``fill_between``. Cheers, Andreas. |
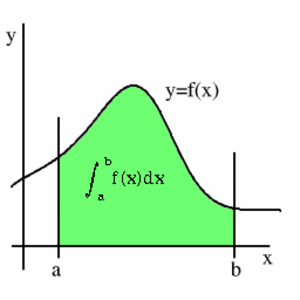
|
From: Francesco M. <fra...@gm...> - 2012-10-16 14:09:34
|
Hi 2012/10/16 ra...@0x... <ra...@0x...> > hi, > > I have a coordination system with some plotted dots connected with a > line. Now I'd like to fill up the whole space between the line and the > x-axis. It is the same as in a integral calculation: > http://www.definicionabc.com/wp-content/uploads/Integral.png > What I want to do is the same as the green color in the linked picture. > Give a look at fill_between. In the link you can find a demo http://matplotlib.org/examples/pylab_examples/fill_between_demo.html About the color, if you have the RGB color of the green you can pass it to fill_between. Is there a way to achieve that with matplotlib? > > thank you > Cheers > > > ------------------------------------------------------------------------------ > Don't let slow site performance ruin your business. Deploy New Relic APM > Deploy New Relic app performance management and know exactly > what is happening inside your Ruby, Python, PHP, Java, and .NET app > Try New Relic at no cost today and get our sweet Data Nerd shirt too! > http://p.sf.net/sfu/newrelic-dev2dev > _______________________________________________ > Matplotlib-users mailing list > Mat...@li... > https://lists.sourceforge.net/lists/listinfo/matplotlib-users > |
|
From: <ra...@0x...> - 2012-10-16 14:01:38
|
hi, I have a coordination system with some plotted dots connected with a line. Now I'd like to fill up the whole space between the line and the x-axis. It is the same as in a integral calculation: http://www.definicionabc.com/wp-content/uploads/Integral.png What I want to do is the same as the green color in the linked picture. Is there a way to achieve that with matplotlib? thank you |
|
From: Phil E. <pel...@gm...> - 2012-10-16 08:53:10
|
To plot a line using pyplot.plot you need an array/list of x coordinates
and an array/list of y coordinates.

So if you have:

data = [[64, 13], [66, 22], [68, 9], [70, 11], [72, 8], [74, 10], [76, 11],
            [78, 8], [80, 9], [82, 9], [84, 15], [86, 13], [88, 5], [90,
9], [92, 13],
            [94, 12], [96, 7]]

You can get a list of xs and a list of ys with:

xs, ys = zip(*data)

>From that point, it is as simple as doing:

import matplotlib.pyplot as plt
plt.plot(xs, ys)


Hope that helps,

Phil


On 16 October 2012 09:39, ra...@0x... <ra...@0x...> wrote:

> [[64, 13], [66, 22], [68, 9], [70, 11], [72, 8], [74, 10], [76, 11],
> [78, 8], [80, 9], [82, 9], [84, 15], [86, 13], [88, 5], [90, 9], [92,
> 13], [94, 12], [96, 7]]
>
|
|
From: <ra...@0x...> - 2012-10-16 08:38:15
|
Hi, I have a 2d array like: [[64, 13], [66, 22], [68, 9], [70, 11], [72, 8], [74, 10], [76, 11], [78, 8], [80, 9], [82, 9], [84, 15], [86, 13], [88, 5], [90, 9], [92, 13], [94, 12], [96, 7]] I'd like to plot a line/graph that goes through all those coordinates specified in the array. What I do: for point in array: plot(point[0], point[1], 'bo-') This draws the dots on the graph as desired - but it does not draw the line between them. Is the data format wrong? thanks |
|
From: Damon M. <dam...@gm...> - 2012-10-16 07:34:30
|
On Tue, Oct 16, 2012 at 8:04 AM, T J <tj...@gm...> wrote: > I'm interested in clipping the result of plt.contour (and > plt.contourf) to a patch. However, QuadContourSet does not have a > set_clip_path() method. Is there a way to do this? > > Here is an example plot that I have generated. > > http://imgur.com/pybIf > > For the curious, it plots contours of a function on the 2-simplex. > The way I've gone about computing this is, unfortunately, convoluted. > I generate a regular grid in 2D and treat each point as a projection > of a 3D probability vector into 2D. Then, I invert the projection so > that I have "distributions" and then compute the Z value for each > point. The contours are then calculated, but now, I need to clip > everything outside the triangle, as only points within the triangle > correspond to actual distributions. > > Is there a more direct way to calculate contours on a restricted set? > > Thanks. The contour functions support masked regions. I think that might be what you're looking for. Since the region you want to mask is a triangle, maybe even use a masked triangulated contour plot? Here's the call signature: http://matplotlib.org/api/pyplot_api.html#matplotlib.pyplot.tricontour Does that help? -- Damon McDougall http://www.damon-is-a-geek.com B2.39 Mathematics Institute University of Warwick Coventry West Midlands CV4 7AL United Kingdom |
|
From: T J <tj...@gm...> - 2012-10-16 07:04:47
|
I'm interested in clipping the result of plt.contour (and plt.contourf) to a patch. However, QuadContourSet does not have a set_clip_path() method. Is there a way to do this? Here is an example plot that I have generated. http://imgur.com/pybIf For the curious, it plots contours of a function on the 2-simplex. The way I've gone about computing this is, unfortunately, convoluted. I generate a regular grid in 2D and treat each point as a projection of a 3D probability vector into 2D. Then, I invert the projection so that I have "distributions" and then compute the Z value for each point. The contours are then calculated, but now, I need to clip everything outside the triangle, as only points within the triangle correspond to actual distributions. Is there a more direct way to calculate contours on a restricted set? Thanks. |
|
From: Damon M. <dam...@gm...> - 2012-10-15 19:05:07
|
On Mon, Oct 15, 2012 at 7:22 PM, Benjamin Root <ben...@ou...> wrote: > > > On Mon, Oct 15, 2012 at 2:11 PM, Damon McDougall <dam...@gm...> > wrote: >> >> I tried a `python setupegg.py develop` to diagnose a bug for someone. >> Now my mpl git repo has magically appeared at the front of my >> sys.path. Since I cleaned out the lib/matplotlib directory, I now get >> import errors like "No module named matplotlib._path" because it's >> looking in my git repo for all the modules. I've spent about an hour >> trying to figure out what else might modified my sys.path and this is >> the conclusion I've come to. I've nuked ~/.pip and ~/.ipython to no >> avail. >> >> Did setupegg modify my sys.path? If so, how do I change it back? >> > > setupegg develop does not modify the sys.path (at least, not permanently -- > not sure exactly what it does deep under the hood). What it does is adds a > .egg-lnk file in your site-packages directory to point to your source code > tree. Get rid of that .egg-lnk file, and you should be good to go. > > Ben Root > That had no affect. I figured it out. easy_install edited a file called easy_install.pth and added a bunch of directories. Cheers for the help. -- Damon McDougall http://www.damon-is-a-geek.com B2.39 Mathematics Institute University of Warwick Coventry West Midlands CV4 7AL United Kingdom |
|
From: Benjamin R. <ben...@ou...> - 2012-10-15 18:23:08
|
On Mon, Oct 15, 2012 at 2:11 PM, Damon McDougall <dam...@gm...>wrote: > I tried a `python setupegg.py develop` to diagnose a bug for someone. > Now my mpl git repo has magically appeared at the front of my > sys.path. Since I cleaned out the lib/matplotlib directory, I now get > import errors like "No module named matplotlib._path" because it's > looking in my git repo for all the modules. I've spent about an hour > trying to figure out what else might modified my sys.path and this is > the conclusion I've come to. I've nuked ~/.pip and ~/.ipython to no > avail. > > Did setupegg modify my sys.path? If so, how do I change it back? > > setupegg develop does not modify the sys.path (at least, not permanently -- not sure exactly what it does deep under the hood). What it does is adds a .egg-lnk file in your site-packages directory to point to your source code tree. Get rid of that .egg-lnk file, and you should be good to go. Ben Root |
|
From: Damon M. <dam...@gm...> - 2012-10-15 18:12:07
|
I tried a `python setupegg.py develop` to diagnose a bug for someone. Now my mpl git repo has magically appeared at the front of my sys.path. Since I cleaned out the lib/matplotlib directory, I now get import errors like "No module named matplotlib._path" because it's looking in my git repo for all the modules. I've spent about an hour trying to figure out what else might modified my sys.path and this is the conclusion I've come to. I've nuked ~/.pip and ~/.ipython to no avail. Did setupegg modify my sys.path? If so, how do I change it back? -- Damon McDougall http://www.damon-is-a-geek.com B2.39 Mathematics Institute University of Warwick Coventry West Midlands CV4 7AL United Kingdom |
|
From: Jarrod M. <mi...@be...> - 2012-10-15 04:55:06
|
Hello, The CFP for SciPy India 2012, to be held in IIT Bombay from December 27-29 is open. Please spread the word! Scipy.in is a conference providing opportunities to spread the use of the Python programming language in the Scientific Computing community in India. It provides a unique opportunity to interact with the "Who's who" of the Python for Scientific Computing fraternity and learn, understand, participate, and contribute to Scientific Computing using Python. Attendees of the conference and participants of the sprints planned will be able to access and review the tools available. They will also be able to learn domain-specific applications and how the tools apply to a plethora of application problems. One of the goals of the conference is to combine education, engineering, and science with computing through the medium of Python. This conference also aims to spread the use of Python for Scientific Computing in various fields and among different communities. Call for Papers ================ We look forward to your submissions on the use of Python for Scientific Computing and Education. This includes pedagogy, exploration, modeling and analysis from both applied and developmental perspectives. We welcome contributions from academia as well as industry. Submission of Papers ===================== If you wish to present your paper using this platform, please submit an abstract of 300 to 700 words describing the topic, including its relevance to scientific computing. Based on the number and quality of the submissions, the conference organizers will allot 10 - 30 minutes for each accepted talk. In addition to these talks, there will be an open session of lightning talks, during which any attendee who wishes to talk on a pertinent topic is invited to do a presentation not exceeding five minutes in duration. If you wish to present a talk at the conference, please follow the guidelines below. Submission Guidelines ====================== - Submit your proposals at sc...@fo... - Submissions whose main purpose is to promote a commercial product or service will be refused. - All accepted proposals must be presented at the SciPy conference by at least one author. Important Dates ================ - Call for proposals start: 27th September 2012, Thursday - Call for proposals end: 1st November 2012, Thursday - List of accepted proposals will be published: 19th November 2012, Monday - Submission of first presentation: 10th December 2012, Monday - Submission of final presentation(with final changes): 20th December 2012, Thursday |
|
From: lulu <lau...@me...> - 2012-10-14 16:14:14
|
Thanks Eric-
I ran this in python 2.6, and got this error:

Traceback (most recent call last):
  File "/Users/laura/Desktop/Bohlen10_12_12.py", line 3, in <module>
    import matplotlib.pyplot as plt
ImportError: No module named matplotlib.pyplot
>>>

So, I am installing matplotlib again.


--
View this message in context: http://matplotlib.1069221.n5.nabble.com/installating-matplotlib-in-mac-10-7-4-for-python-2-6-tp39436p39451.html
Sent from the matplotlib - users mailing list archive at Nabble.com.
|
|
From: Eric F. <ef...@ha...> - 2012-10-14 08:22:09
|
On 2012/10/13 6:41 PM, lulu wrote: > oh brother -- so now I've got to deal w/ Apple... I don't see what Apple has to do with it. > okay thanks. > > here's where I am. > > I've downloaded matplotlib, numpy, python 2.7.3, xcode and macports to > simply plot this oh-so-simple code! > Which is: > > Curve fitting with python and pylab > #import the lib > from pylab import * > # assuming this data set > t = (0,5,10,15,20,25,30,35,40,50) > V = (1,7,14,15,16,22,25,27,28,30) > #show the data > plot(t, v, linewidth=2.0) > #assume an order > N = ? > #find the coefficient of the polynomial > coeffs = polyfit(t,v,N) > #get the polynomial output for the input > best = polyval(coeffs, t) > #print the coefficients > print(coeffs) > > I have written it like this in python 2.6: > > import os,sys > import numpy > #import pylab > > t = (0,5,10,15,20,25,30,35,40,50) > V = (1,7,14,15,16,22,25,27,28,30) > #scipy.plot(t,v,linewidth=2.0) > > n = 4 > coeffs = numpy.polyfit(t,V,n) > > best = numpy.polyval(coeffs,t) > > print coeffs > print best > > and when I run the program, I get this: > [ -1.68165168e-05 1.71262071e-03 -6.39152514e-02 1.59163337e+00 > 1.04578755e+00] > [ 1.04578755 7.60964036 12.11505162 15.46811522 18.32267732 > 21.08033633 23.89044289 26.6500999 29.0041625 29.81368631] > > when I run in 2.7.3 it looks like this: > import os,sys > import numpy as np > import pylab > > t = (0,5,10,15,20,25,30,35,40,50) > V = (1,7,14,15,16,22,25,27,28,30) > #scipy.plot(t,v,linewidth=2.0) > > n = 4 > coeffs = numpy.polyfit(t,V,n) > > best = numpy.polyval(coeffs,t) > > print coeffs > print best > > > And my error msg is this: > ImportError: No module named numpy > > any ideas? The problem in python 2.7 starts with the fact that numpy is evidently not installed for 2.7. Each version of python has its own set of libraries, so installing numpy for 2.6 does nothing for 2.7, and vice-versa. > What I'm looking for is a visual. With python 2.6, you may be almost there. Try running this in python 2.6: import numpy as np import matplotlib.pyplot as plt t = (0,5,10,15,20,25,30,35,40,50) V = (1,7,14,15,16,22,25,27,28,30) plt.plot(t, V, linewidth=2.0) n = 4 coeffs = np.polyfit(t,V,n) best = np.polyval(coeffs,t) print coeffs print best plt.show() Eric |
|
From: lulu <lau...@me...> - 2012-10-14 04:42:02
|
oh brother -- so now I've got to deal w/ Apple... okay thanks. here's where I am. I've downloaded matplotlib, numpy, python 2.7.3, xcode and macports to simply plot this oh-so-simple code! Which is: Curve fitting with python and pylab #import the lib from pylab import * # assuming this data set t = (0,5,10,15,20,25,30,35,40,50) V = (1,7,14,15,16,22,25,27,28,30) #show the data plot(t, v, linewidth=2.0) #assume an order N = ? #find the coefficient of the polynomial coeffs = polyfit(t,v,N) #get the polynomial output for the input best = polyval(coeffs, t) #print the coefficients print(coeffs) I have written it like this in python 2.6: import os,sys import numpy #import pylab t = (0,5,10,15,20,25,30,35,40,50) V = (1,7,14,15,16,22,25,27,28,30) #scipy.plot(t,v,linewidth=2.0) n = 4 coeffs = numpy.polyfit(t,V,n) best = numpy.polyval(coeffs,t) print coeffs print best and when I run the program, I get this: [ -1.68165168e-05 1.71262071e-03 -6.39152514e-02 1.59163337e+00 1.04578755e+00] [ 1.04578755 7.60964036 12.11505162 15.46811522 18.32267732 21.08033633 23.89044289 26.6500999 29.0041625 29.81368631] when I run in 2.7.3 it looks like this: import os,sys import numpy as np import pylab t = (0,5,10,15,20,25,30,35,40,50) V = (1,7,14,15,16,22,25,27,28,30) #scipy.plot(t,v,linewidth=2.0) n = 4 coeffs = numpy.polyfit(t,V,n) best = numpy.polyval(coeffs,t) print coeffs print best And my error msg is this: ImportError: No module named numpy any ideas? What I'm looking for is a visual. -- View this message in context: http://matplotlib.1069221.n5.nabble.com/installating-matplotlib-in-mac-10-7-4-for-python-2-6-tp39436p39448.html Sent from the matplotlib - users mailing list archive at Nabble.com. |
|
From: Eric F. <ef...@ha...> - 2012-10-14 04:26:59
|
On 2012/10/13 6:11 PM, lulu wrote: > okay - thanks... > so I did THAT - but am prompted for a password. > I assumed the password would be my administrator, but it isn't..... > Where would I find that? Sudo is prompting you for your user password. Depending on how your machine was set up, you might not have permission to use sudo. Sudo is a mechanism for allowing users to do things that would otherwise require the highest level of permissions. Eric > > btw - thank you ALL for all the help! > > > > -- > View this message in context: http://matplotlib.1069221.n5.nabble.com/installating-matplotlib-in-mac-10-7-4-for-python-2-6-tp39436p39446.html > Sent from the matplotlib - users mailing list archive at Nabble.com. > > ------------------------------------------------------------------------------ > Don't let slow site performance ruin your business. Deploy New Relic APM > Deploy New Relic app performance management and know exactly > what is happening inside your Ruby, Python, PHP, Java, and .NET app > Try New Relic at no cost today and get our sweet Data Nerd shirt too! > http://p.sf.net/sfu/newrelic-dev2dev > _______________________________________________ > Matplotlib-users mailing list > Mat...@li... > https://lists.sourceforge.net/lists/listinfo/matplotlib-users > |
|
From: lulu <lau...@me...> - 2012-10-14 04:11:58
|
okay - thanks... so I did THAT - but am prompted for a password. I assumed the password would be my administrator, but it isn't..... Where would I find that? btw - thank you ALL for all the help! -- View this message in context: http://matplotlib.1069221.n5.nabble.com/installating-matplotlib-in-mac-10-7-4-for-python-2-6-tp39436p39446.html Sent from the matplotlib - users mailing list archive at Nabble.com. |
|
From: Eric F. <ef...@ha...> - 2012-10-14 04:06:04
|
On 2012/10/13 6:03 PM, lulu wrote: > Okay -- > I opened terminal, typed 'python' to being, then typed: There's the problem: don't type "python" to begin, just type the lines below directly in the terminal window. Eric > sudo port install py26-python > sudo port install py26-matplotlib > > I recieved syntax errors: > >>>> sudo port install py26-python > File "<stdin>", line 1 > sudo port install py26-python > ^ > SyntaxError: invalid syntax >>>> sudo port install py26-matplotlib > File "<stdin>", line 1 > sudo port install py26-matplotlib > > > > -- > View this message in context: http://matplotlib.1069221.n5.nabble.com/installating-matplotlib-in-mac-10-7-4-for-python-2-6-tp39436p39444.html > Sent from the matplotlib - users mailing list archive at Nabble.com. > > ------------------------------------------------------------------------------ > Don't let slow site performance ruin your business. Deploy New Relic APM > Deploy New Relic app performance management and know exactly > what is happening inside your Ruby, Python, PHP, Java, and .NET app > Try New Relic at no cost today and get our sweet Data Nerd shirt too! > http://p.sf.net/sfu/newrelic-dev2dev > _______________________________________________ > Matplotlib-users mailing list > Mat...@li... > https://lists.sourceforge.net/lists/listinfo/matplotlib-users > |
657 messages has been excluded from this view by a project administrator.
