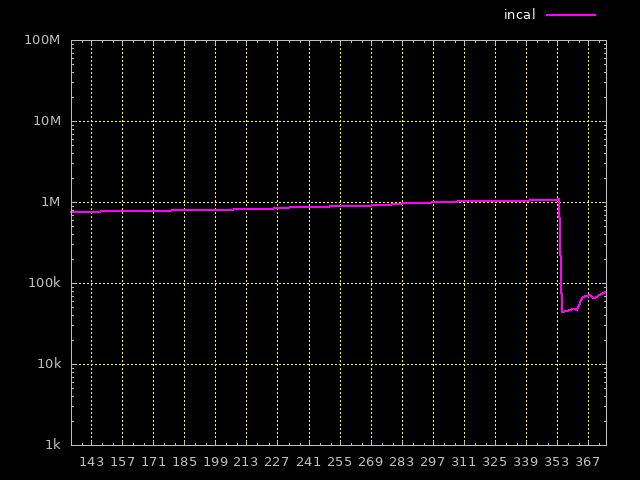
Now it's almost good except it still counts from 0, so day 170
is actually day 171. I don't know how that can be changed, I'm
tempted to add a bogus line to the data ... but no. Don't know
what else to do tho?

Take a look:
  https://dataswamp.org/~incal/hits/hits.png

TIA

#! /usr/local/bin/gnuplot
#
# this file:
#   https://dataswamp.org/~incal/hits/hits.gpi
#
# the graph:
#   https://dataswamp.org/~incal/hits/hits.png

reset

set term png background rgb "black"
set out "/home/incal/public_html/hits/hits.png"

set tics font "verdana,10"

set format y "%.0s%c"
set logscale y
set yrange[1000:1e9]

set format x "%s" timedate
set xtics 2,7
set xrange [146:] noextend

set grid   lc "yellow"
set border lc "gray"

set key outside top right spacing 1.4 tc "white" font "verdana,10" horizontal

data="/home/incal/public_html/hits/hits.dat"
plot \
 data u 1 w l lc "cyan"    lw 2 t "solene",   \
 data u 2 w l lc "magenta" lw 2 t "incal",    \
 data u 3 w l lc "yellow"  lw 2 t "lich",     \
 data u 4 w l lc "green"   lw 2 t "josk",     \
 data u 5 w l lc "white"   lw 2 t "rjc",      \
 data u 6 w l lc "red"     lw 2 t "katzeilla"

--
underground experts united
https://dataswamp.org/~incal
|