
Menu
▾
▴
gnuplot-info
|
From: Emanuel B. <in...@da...> - 2022-06-22 07:15:19
|
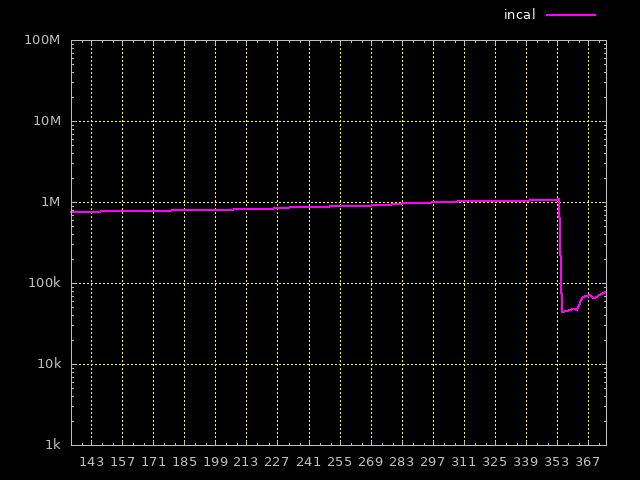
How do I get a bright-on-theme? I did 'set term png background rgb 'black'' but then how do I do everything else bright? TIA https://dataswamp.org/~incal/hits/hits.dat https://dataswamp.org/~incal/hits/hits.gpi https://dataswamp.org/~incal/hits/hits.png -- underground experts united https://dataswamp.org/~incal |
|
From: Norwid B. <nb...@ya...> - 2022-06-22 10:02:51
|
Emanuel Berg <in...@da...> wrote: > How do I get a bright-on-theme? I did 'set term png background > rgb 'black'' but then how do I do everything else bright? Like "black", there is "white", i.e. an instruction like ``` set term pngcairo background rgb "white" ``` to expand all over the canvas*) equally is possible. *) If your aim is to alter the representation only within the plot, but not on the caption, legend, etc, you still could put a rectangle behind (back) the plot. As a verbose minimal working example: ``` set terminal pngcairo set output "test.png" set object 1 rect from graph 0, graph 0 to graph 1, graph 1 back set object 1 rect fc rgb "gray" fillstyle solid 1.0 plot sin(x) ``` With regards |
|
From: Emanuel B. <in...@da...> - 2022-06-22 16:45:14
|
Norwid Behrnd via gnuplot-info wrote: >> How do I get a bright-on-theme? I did 'set term png >> background rgb 'black'' but then how do I do everything >> else bright? > > Like "black", there is "white", i.e. an instruction like > > set term pngcairo background rgb "white" As you see I've successfully set the background to gray, a compromise where the black lines of everything else is still visible. However I'd like to set the background to black. I happens the same way but how do I then set everything else to bright color(s) so they are still visible? This was once known as a bright-on-black theme, now it seems it is called "dark mode". But that's what I desire anyway :) If you know how to achieve it? -- underground experts united https://dataswamp.org/~incal |
|
From: theozh <th...@gm...> - 2022-06-22 17:59:50
|
You simply have to set the linecolor and textcolor of all the other objects, e.g. borders, labels, tics, etc. to "white". See, e.g. https://stackoverflow.com/questions/72668058 Am 22.06.2022 um 08:56 schrieb Emanuel Berg: > How do I get a bright-on-theme? I did 'set term png background > rgb 'black'' but then how do I do everything else bright? > > TIA > > https://dataswamp.org/~incal/hits/hits.dat > https://dataswamp.org/~incal/hits/hits.gpi > https://dataswamp.org/~incal/hits/hits.png |
|
From: mark_at_yahoo <mar...@ya...> - 2022-06-22 18:56:13
|
On 6/22/22 10:59 AM, theozh wrote:
> You simply have to set the linecolor and textcolor of all the other
> objects, e.g. borders, labels, tics, etc. to "white".

I have a similar, long-standing problem if you have the time to consider
it. I've done all the above and they work perfectly, with the exception
of the "drag rectangle to define new zoom region". I've tried but never
succeeded in changing that from its default dark blue color, which is
almost invisible on a black background.

I believe I'm using the default "qt" terminal. It won't accept a
"background" argument in `set terminal` so instead I've been doing:

     set object 1 rectangle from screen 0,0 to screen 1,1 fillcolor rgb
"black" behind

The example code in the StackOverflow link you posted (thanks!) using
`set terminal wxt ...` works better -- the rectangle is light-colored
and visible -- but the text with the coordinates of the rectangle is
still a dark color and unreadable.

Is there a way to change the color of all of these interactive
mouse-feedback elements in addition to the plot graphics? Thanks in
advance for any suggestions.
|
|
From: Emanuel B. <in...@da...> - 2022-06-22 18:10:20
|
theozh wrote: > You simply have to set the linecolor and textcolor of all the > other objects, e.g. borders, labels, tics, etc. to "white". Yes but _how_? This is what I'm asking. > https://stackoverflow.com/questions/72668058 ? -- underground experts united https://dataswamp.org/~incal |
|
From: theozh <th...@gm...> - 2022-06-22 18:15:18
|
Please read and study the answer in detail to that linked question! You can also read the docs. In gnuplot console type: help borders, help xtics, etc.. One example hint: `set border lc "white" Am 22.06.2022 um 20:09 schrieb Emanuel Berg: > theozh wrote: > >> You simply have to set the linecolor and textcolor of all the >> other objects, e.g. borders, labels, tics, etc. to "white". > > Yes but _how_? This is what I'm asking. > >> https://stackoverflow.com/questions/72668058 > > ? > |
|
From: Emanuel B. <in...@da...> - 2022-06-23 01:47:50
|
theozh wrote: > You can also read the docs. > In gnuplot console type: help borders, help xtics, etc.. > One example hint: `set border lc "white" Thanks but for the key and title lc is an "unknown key option"? -- underground experts united https://dataswamp.org/~incal |
|
From: theozh <th...@gm...> - 2022-06-23 04:06:48
|
> You simply have to set the linecolor and textcolor of all the other objects, e.g. borders, labels, tics, etc. to "white". Please read the documentation of `help key` and `help title`. There is an option "textcolor" or "tc" Am 23.06.2022 um 03:47 schrieb Emanuel Berg: > theozh wrote: > >> You can also read the docs. >> In gnuplot console type: help borders, help xtics, etc.. >> One example hint: `set border lc "white" > > Thanks but for the key and title lc is an "unknown key > option"? > |
|
From: Emanuel B. <in...@da...> - 2022-06-23 06:53:22
|
theozh wrote: >>> You can also read the docs. In gnuplot console type: help >>> borders, help xtics, etc.. One example hint: `set border >>> lc "white" >> >> Thanks but for the key and title lc is an "unknown key >> option"? > > Please read the documentation of `help key` and `help > title`. There is an option "textcolor" or "tc" Ah, now I understand where the console is. In the console! Thanks, that did it! Now just some polishing and trying-out with the colors and all set :) https://dataswamp.org/~incal/hits/hits.gpi https://dataswamp.org/~incal/hits/hits.png -- underground experts united https://dataswamp.org/~incal |
|
From: Emanuel B. <in...@da...> - 2022-06-23 07:11:29
|
theozh wrote: > You simply have to set the linecolor and textcolor of all > the other objects, e.g. borders, labels, tics, etc. > to "white". How do you set the size of the numbers for the y-axis? This set ylabel font "verdana,11" doesn't seem to take. -- underground experts united https://dataswamp.org/~incal |
|
From: Emanuel B. <in...@da...> - 2022-06-23 07:22:57
|
>> You simply have to set the linecolor and textcolor of all >> the other objects, e.g. borders, labels, tics, etc. >> to "white". > > How do you set the size of the numbers for the y-axis? ytics Getting the hang of it :) -- underground experts united https://dataswamp.org/~incal |

