Menu
▾
▴
gnuplot-info
|
From: Robert H. <he...@de...> - 2026-02-07 20:47:25
|
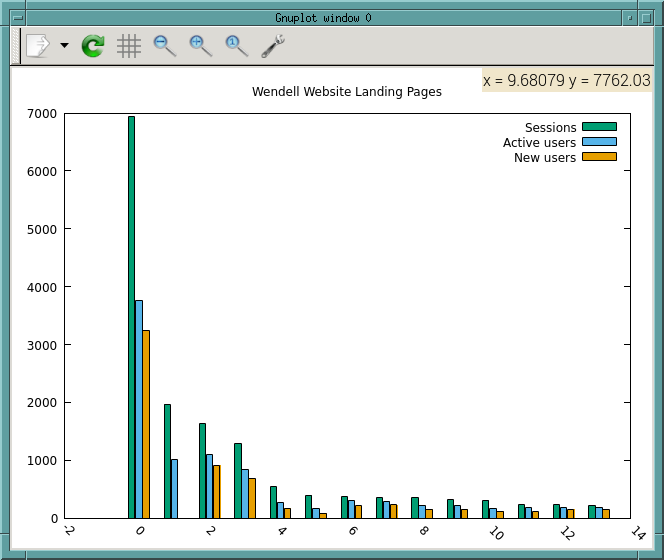
I downloaded the file at https://gnuplot.sourceforge.net/demo_5.4/histograms.2.gnu and edited to suit my data file: #!/usr/bin/gnuplot -persist set datafile separator comma set datafile columnheaders set boxwidth 0.9 absolute set style fill solid 1.00 border lt -1 set key fixed right top vertical Right noreverse noenhanced autotitle nobox set style histogram clustered gap 1 title textcolor lt -1 unset parametric set datafile missing '-' set style data histograms set xtics border in scale 0,0 nomirror rotate by -45 autojustify set xtics norangelimit set xtics () set title "Wendell Website Landing Pages" set xrange [ * : * ] noreverse writeback set x2range [ * : * ] noreverse writeback set yrange [ 0.00000 : 7000. ] noreverse writeback set y2range [ * : * ] noreverse writeback set zrange [ * : * ] noreverse writeback set cbrange [ * : * ] noreverse writeback set rrange [ * : * ] noreverse writeback set colorbox vertical origin screen 0.9, 0.2 size screen 0.05, 0.6 front noinvert bdefault NO_ANIMATION = 1 plot "WendellWebsite-Jan1-Dec31-2025-Landing_page_Landing_page.csv" \ using 1:xticlabels(1), '' u 2 ti col, '' u 3 ti col, '' u 4 ti col But while it *mostly* works, it does not do the xtic labels, as shown in this screen shot: https://www.deepsoft.com/wp-content/uploads/2026/02/Screenshot-from-2026-02-07-15-41-28.png What am I doing wrong? The data file looks like this: # ---------------------------------------- # Landing page: Landing page # Account: www.wendellmass.us # Property: http://www.wendellmass.us - GA4 # ---------------------------------------- # # All Users # Start date: 20250101 # End date: 20251231 Landing page,Sessions,Active users,New users,Average engagement time per session,Key events,Total revenue,Session key event rate /,6936,3766,3239,71.99423298731257,0,0,0 (not set),1972,1005,0,12.278904665314402,0,0,0 /departments/library,1629,1092,918,36.09821976672806,0,0,0 /departments/recycling-and-transfer-station,1282,842,682,23.013260530421217,0,0,0 /town-government,543,273,175,93.43093922651934,0,0,0 /departments/public-meetings,397,160,86,69.7632241813602,0,0,0 /departments,367,304,211,116.20708446866485,0,0,0 /departments/property-assessment,351,291,233,34.69230769230769,0,0,0 /online-payment-bill-lookup,351,219,156,26.974358974358974,0,0,0 /departments/tax-collector,316,220,150,42.08227848101266,0,0,0 /departments/building-department,304,170,117,66.35197368421052,0,0,0 /departments/town-clerk,233,176,112,37.927038626609445,0,0,0 /good-neighbors,228,179,151,38.31140350877193,0,0,0 /jobs,223,182,144,27.60089686098655,0,0,0 -- Robert Heller -- Cell: 413-658-7953 GV: 978-633-5364 Deepwoods Software -- Custom Software Services http://www.deepsoft.com/ -- Linux Administration Services he...@de... -- Webhosting Services |
|
From: Norwid B. <nb...@ya...> - 2026-02-08 11:29:36
|
Dear Robert The example shared by you includes three consecutive lines relevant to the management of xtics: > set xtics border in scale 0,0 nomirror rotate by -45 autojustify > set xtics norangelimit > set xtics () By `set xtics scale 0,0` you however set them invisible. Compare for example the result of ``` set terminal png set output "test_01.png" set title "test 01" set xtics in scale 0,0 plot sin(x) ``` with (an exaggerated example) ``` set terminal png set output "test_02.png" set title "test 02" set xtics in scale 10,0 plot sin(x) ``` Equally, compare with the first example "US immigration from Europe by decade" on <https://gnuplot.sourceforge.net/demo_5.4/histograms2.html> -- sometimes the tics extend beyond the bars (e.g., 1931--1940, Northern Europe) to be visible, while e.g., about 1901--1910 they are not. Here, `set xtics out` yields xtics which don't enter the first quadrant and hence are not affected by the histogram's bars. In your example, the annotations to the abscissa are short; this is the reason why I think to use `set xtics out` without a `rotate by -45` provides a result easier to read and ``` set xtics out border nomirror autojustify set xtics norangelimit ``` might suffice. Note `set xtics ()` can void your earlier list of instructions about the xtics. Best regards, Norwid |
|
From: Robert H. <he...@de...> - 2026-02-08 15:56:11
|
None of this helps. The X Tick labels are still the numberical indexes and not the text in column of the data file. At Sun, 8 Feb 2026 11:38:29 +0100 Norwid Behrnd <nb...@ya...> wrote: > > Dear Robert > > The example shared by you includes three consecutive lines relevant to the > management of xtics: > > > set xtics border in scale 0,0 nomirror rotate by -45 autojustify > > set xtics norangelimit > > set xtics () > > By `set xtics scale 0,0` you however set them invisible. Compare for example > the result of > > ``` > set terminal png > set output "test_01.png" > set title "test 01" > > set xtics in scale 0,0 > plot sin(x) > ``` > > with (an exaggerated example) > > ``` > set terminal png > set output "test_02.png" > set title "test 02" > > set xtics in scale 10,0 > plot sin(x) > ``` > > Equally, compare with the first example "US immigration from Europe by decade" > on <https://gnuplot.sourceforge.net/demo_5.4/histograms2.html> -- sometimes the > tics extend beyond the bars (e.g., 1931--1940, Northern Europe) to be visible, > while e.g., about 1901--1910 they are not. Here, `set xtics out` yields xtics > which don't enter the first quadrant and hence are not affected by the > histogram's bars. > > In your example, the annotations to the abscissa are short; this is the reason > why I think to use `set xtics out` without a `rotate by -45` provides a result > easier to read and > > ``` > set xtics out border nomirror autojustify > set xtics norangelimit > ``` > > might suffice. Note `set xtics ()` can void your earlier list of instructions > about the xtics. > > Best regards, > > Norwid > > > -- Robert Heller -- Cell: 413-658-7953 GV: 978-633-5364 Deepwoods Software -- Custom Software Services http://www.deepsoft.com/ -- Linux Administration Services he...@de... -- Webhosting Services |
|
From: Robert H. <he...@de...> - 2026-02-08 16:43:56
|
At Sun, 8 Feb 2026 07:17:35 -0500 (EST) Robert Heller <he...@de...> wrote: > > None of this helps. The X Tick labels are still the numberical indexes and > not the text in column of the data file. > I found my problem: doing "1:xtick(1)" is wrong! I moved the ":xtic(1)" elsewhere in the using list and presto, things work. > At Sun, 8 Feb 2026 11:38:29 +0100 Norwid Behrnd <nb...@ya...> wrote: > > > > > Dear Robert > > > > The example shared by you includes three consecutive lines relevant to the > > management of xtics: > > > > > set xtics border in scale 0,0 nomirror rotate by -45 autojustify > > > set xtics norangelimit > > > set xtics () > > > > By `set xtics scale 0,0` you however set them invisible. Compare for example > > the result of > > > > ``` > > set terminal png > > set output "test_01.png" > > set title "test 01" > > > > set xtics in scale 0,0 > > plot sin(x) > > ``` > > > > with (an exaggerated example) > > > > ``` > > set terminal png > > set output "test_02.png" > > set title "test 02" > > > > set xtics in scale 10,0 > > plot sin(x) > > ``` > > > > Equally, compare with the first example "US immigration from Europe by decade" > > on <https://gnuplot.sourceforge.net/demo_5.4/histograms2.html> -- sometimes the > > tics extend beyond the bars (e.g., 1931--1940, Northern Europe) to be visible, > > while e.g., about 1901--1910 they are not. Here, `set xtics out` yields xtics > > which don't enter the first quadrant and hence are not affected by the > > histogram's bars. > > > > In your example, the annotations to the abscissa are short; this is the reason > > why I think to use `set xtics out` without a `rotate by -45` provides a result > > easier to read and > > > > ``` > > set xtics out border nomirror autojustify > > set xtics norangelimit > > ``` > > > > might suffice. Note `set xtics ()` can void your earlier list of instructions > > about the xtics. > > > > Best regards, > > > > Norwid > > > > > > > -- Robert Heller -- Cell: 413-658-7953 GV: 978-633-5364 Deepwoods Software -- Custom Software Services http://www.deepsoft.com/ -- Linux Administration Services he...@de... -- Webhosting Services |

Thanks for helping keep SourceForge clean.
X