|
From: Kristis M. <kri...@as...> - 2007-02-09 20:07:24
|
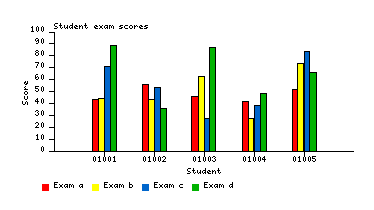
Hello, I'm having a hard time finding a gnuplot example that shows how I can produce a bar graph, like the one in the following link, that will have each bar adjacent to each other. http://ploticus.sourceforge.net/gallery/students.gif Could someone point me to the right direction ? Thanks, Kristis |
|
From: Lars H. <la...@ho...> - 2007-02-09 21:48:11
|
> I'm having a hard time finding a gnuplot example that > shows how I can produce a bar graph, like the one in the > following link, that will have each bar adjacent to each > other. > Could someone point me to the right direction ? Hi! I'm not sure wheter you simply ask for the plotting option "with boxes", or if you would like to learn more about this plotting style. Have you already read "help boxwidth"? This option determines how gnuplot sets the widths of the boxes/bars. If yes, please try to describe a little more precisely, what you desire. Regards Lars |
|
From: Kristis M. <kri...@as...> - 2007-02-09 23:19:54
Attachments:
graph_20000.eps
|
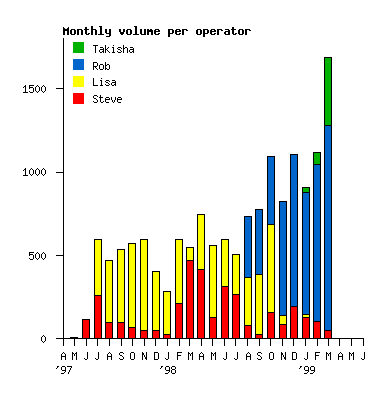
Hi Lars, I'm using the "with boxes" option. I'm trying in particular to align the produced boxes to be one next to the other, instead of stacked on top to each other. In other words, I'm currently producing a graph that shows totals (or just the bigger box overshadowing the smaller one) as in: http://ploticus.sourceforge.net/gallery/bars3.gif ...while I'm trying to show all boxes right next to each other so someone can visually compare them, as in: http://ploticus.sourceforge.net/gallery/students.gif I'm running the following script: ++++++++++++++++++++++++++ set output "results/graph_20000.eps" set terminal postscript eps color set style fill solid 1.0 border -1 set boxwidth 0.75 relative set autoscale set datafile separator "," plot [0:20000] "results/graph_20000.csv" using 1:2 with boxes, \ "results/graph_20000.csv" using 1:3 with boxes, \ "results/graph_20000.csv" using 1:4 with boxes, \ "results/graph_20000.csv" using 1:5 with boxes, \ "results/graph_20000.csv" using 1:6 with boxes ++++++++++++++++++++++++++ ...which produces the attached graph. In this graph I can't see any of the green, blue or mauve boxes. I'd like to be able to see them all, next to each other instead of "stacked". This type of graph seems rather elementary. I must definitely be missing something. The "help boxwidth" option seems to generally refer to the width of all boxes combined. I suppose I need to somehow "group" these boxes together. On Fri, 2007-02-09 at 22:53 +0100, Lars Hoegen wrote: > > I'm having a hard time finding a gnuplot example that > > shows how I can produce a bar graph, like the one in the > > following link, that will have each bar adjacent to each > > other. > > Could someone point me to the right direction ? > > > Hi! > I'm not sure wheter you simply ask for the plotting option > "with boxes", or if you would like to learn more about this > plotting style. Have you already read "help boxwidth"? This > option determines how gnuplot sets the widths of the > boxes/bars. If yes, please try to describe a little more > precisely, what you desire. > > Regards > Lars > > |
|
From: <HBB...@t-...> - 2007-02-10 17:26:30
|
Kristis Makris wrote:
> I'm having a hard time finding a gnuplot example that shows how I can
> produce a bar graph, like the one in the following link, that will have
> each bar adjacent to each other.
Fix their width with 'set boxwidth', then use the 'using' option to
shift the boxes' x position around. E.g.:
set boxwidth 0.04
plot 'data' using ($1-0.02):2 with boxes, \
'data' using ($1+0.02):2 with boxes
|
|
From: Kristis M. <kri...@as...> - 2007-02-10 19:30:25
|
OK, will do. It seems that gnuplot 4.2 has support for this "clustering" of boxes: http://gnuplot.sourceforge.net/demo_4.2/histograms.html Other people had to write their own scripts for automatically producing these boxwidths: http://www.burningcutlery.com/derek/bargraph/ Scary! On Sat, 2007-02-10 at 18:27 +0100, Hans-Bernhard Bröker wrote: > Kristis Makris wrote: > > I'm having a hard time finding a gnuplot example that shows how I can > > produce a bar graph, like the one in the following link, that will have > > each bar adjacent to each other. > > Fix their width with 'set boxwidth', then use the 'using' option to > shift the boxes' x position around. E.g.: > > set boxwidth 0.04 > plot 'data' using ($1-0.02):2 with boxes, \ > 'data' using ($1+0.02):2 with boxes > |