Menu
▾
▴
gnuplot-bugs — Place to submit bug reports on gnuplot
You can subscribe to this list here.
| 2003 |
Jan
|
Feb
|
Mar
|
Apr
|
May
|
Jun
|
Jul
|
Aug
|
Sep
|
Oct
|
Nov
|
Dec
(2) |
|---|---|---|---|---|---|---|---|---|---|---|---|---|
| 2004 |
Jan
(1) |
Feb
(2) |
Mar
(2) |
Apr
(22) |
May
(14) |
Jun
(18) |
Jul
(19) |
Aug
(7) |
Sep
(4) |
Oct
(6) |
Nov
(12) |
Dec
(14) |
| 2005 |
Jan
(15) |
Feb
(11) |
Mar
(11) |
Apr
(9) |
May
(119) |
Jun
(25) |
Jul
(16) |
Aug
(19) |
Sep
(26) |
Oct
(14) |
Nov
(7) |
Dec
(45) |
| 2006 |
Jan
(22) |
Feb
(7) |
Mar
(11) |
Apr
(11) |
May
(12) |
Jun
(19) |
Jul
(12) |
Aug
(5) |
Sep
(21) |
Oct
(33) |
Nov
(42) |
Dec
(34) |
| 2007 |
Jan
(26) |
Feb
(27) |
Mar
(54) |
Apr
(37) |
May
(68) |
Jun
(81) |
Jul
(55) |
Aug
(86) |
Sep
(60) |
Oct
(33) |
Nov
(33) |
Dec
(47) |
| 2008 |
Jan
(37) |
Feb
(37) |
Mar
(52) |
Apr
(63) |
May
(98) |
Jun
(70) |
Jul
(61) |
Aug
(38) |
Sep
(64) |
Oct
(55) |
Nov
(48) |
Dec
(111) |
| 2009 |
Jan
(68) |
Feb
(83) |
Mar
(102) |
Apr
(140) |
May
(156) |
Jun
(65) |
Jul
(75) |
Aug
(26) |
Sep
(28) |
Oct
(31) |
Nov
(38) |
Dec
(78) |
| 2010 |
Jan
(53) |
Feb
(33) |
Mar
(87) |
Apr
(94) |
May
(77) |
Jun
(84) |
Jul
(66) |
Aug
(74) |
Sep
(53) |
Oct
(40) |
Nov
(38) |
Dec
(31) |
| 2011 |
Jan
(19) |
Feb
(17) |
Mar
(43) |
Apr
(53) |
May
(42) |
Jun
(35) |
Jul
(19) |
Aug
|
Sep
|
Oct
|
Nov
(7) |
Dec
|
| 2012 |
Jan
(1) |
Feb
(1) |
Mar
(1) |
Apr
(2) |
May
|
Jun
|
Jul
|
Aug
|
Sep
|
Oct
|
Nov
|
Dec
|
| 2013 |
Jan
|
Feb
|
Mar
|
Apr
(1) |
May
|
Jun
|
Jul
|
Aug
(1) |
Sep
(1) |
Oct
(1) |
Nov
(1) |
Dec
|
| 2014 |
Jan
|
Feb
|
Mar
(1) |
Apr
|
May
|
Jun
|
Jul
|
Aug
|
Sep
|
Oct
(3) |
Nov
|
Dec
|
| 2016 |
Jan
|
Feb
|
Mar
|
Apr
(1) |
May
|
Jun
|
Jul
|
Aug
|
Sep
|
Oct
|
Nov
|
Dec
(4) |
| 2017 |
Jan
(1) |
Feb
(3) |
Mar
|
Apr
|
May
(2) |
Jun
|
Jul
|
Aug
|
Sep
|
Oct
(1) |
Nov
|
Dec
|
| 2018 |
Jan
|
Feb
|
Mar
|
Apr
(1) |
May
|
Jun
|
Jul
|
Aug
|
Sep
(1) |
Oct
(2) |
Nov
|
Dec
(1) |
| 2020 |
Jan
|
Feb
|
Mar
|
Apr
|
May
|
Jun
(1) |
Jul
|
Aug
|
Sep
|
Oct
|
Nov
|
Dec
|
| 2021 |
Jan
|
Feb
|
Mar
|
Apr
(1) |
May
|
Jun
|
Jul
|
Aug
|
Sep
(2) |
Oct
|
Nov
|
Dec
|
| 2022 |
Jan
|
Feb
|
Mar
|
Apr
|
May
(3) |
Jun
|
Jul
|
Aug
|
Sep
(4) |
Oct
|
Nov
|
Dec
|
| 2024 |
Jan
(1) |
Feb
|
Mar
(2) |
Apr
|
May
|
Jun
|
Jul
|
Aug
|
Sep
|
Oct
|
Nov
|
Dec
|
| 2025 |
Jan
|
Feb
|
Mar
|
Apr
|
May
|
Jun
|
Jul
(5) |
Aug
|
Sep
|
Oct
|
Nov
|
Dec
|
| 2026 |
Jan
|
Feb
(1) |
Mar
|
Apr
|
May
|
Jun
|
Jul
|
Aug
|
Sep
|
Oct
|
Nov
|
Dec
|
|
From: Александр М. <ale...@li...> - 2026-02-17 11:47:36
|
Dear all, sorry for submitting a patch in an irregular way, but I was unable to login to SourceForge: the CloudFlare security check loops infinitely. The patch refers to the bug I was able to file anonymously: https://sourceforge.net/p/gnuplot/bugs/2858/. I will reproduce its text here: If an SVG file with "mouse" is created, embedded into a web page and then opened in a browser, parseSettings() in gnuplot_svg() in gnuplot_svg.js tries to convert the commented JavaScript with statements like gnuplot_svg.setting = (value); into JSON. However, the comment fragment contains more newlines than expected and, after all regexes are applied, has double commas, commas in the beginning and commas in the end; causing JSON.parse() to fail, breaking all the subsequent JavaScript. I would like to submit a patch fixing this, and for this purpose am creating this bug. The proposed patch replaces the attempts to parse JavaScript with regular expressions with eval(), wrepped, inside and outside, with anonymous functions. I and enclosing the short patch, and copying it below, in case this mailing list does not process attachments: diff --git a/term/js/gnuplot_svg.js b/term/js/gnuplot_svg.js index 3d5541dd3..002b3a2ae 100644 --- a/term/js/gnuplot_svg.js +++ b/term/js/gnuplot_svg.js @@ -93,18 +93,7 @@ gnuplot_svg = function (svgElement) { // continous sections witch will lead to failure if we dont // combine them back into 1 var scriptText = script[1].innerHTML.replaceAll("<![CDATA[", "").replaceAll("]]>", "") - // Remove inline comments - scriptText = scriptText.replace(/^\s*\/\/.*\n/g, ''); - // Change prefix to " - scriptText = scriptText.replace(/gnuplot_svg\./g, '"'); - // Change = to " : - scriptText = scriptText.replace(/ = /g, '" : '); - // Change line endings to comma - scriptText = scriptText.replace(/;\n|\n/g, ','); - // Remove last comma - scriptText = scriptText.replace(/,+$/, ''); - // Parse as json string - settings = JSON.parse("{\n" + scriptText + "\n}"); + settings = ( () => eval( '( () => { let gnuplot_svg = {}; ' + scriptText + ' return gnuplot_svg; } )();' ) )(); } }; -- Alexander Mashin |
|
From: Erik L. <eri...@gm...> - 2025-07-11 18:26:55
|
Ok, that is reasonable. I will leave it at the default. Erik On Fri, Jul 11, 2025 at 12:47 PM Hans-Bernhard Bröker <HBB...@t-...> wrote: > Am 11.07.2025 um 19:19 schrieb Erik Luijten: > > > About SAMPLES, I would argue that any plotting program will have to > > discreetly sample a function in order to plot it (i.e., I do not view it > as > > an important point to convey to new users), but I accept your > perspective. > > That being said, would I cause problems/incompatibilities if I set > SAMPLES > > to a different value in the precompiled binaries that I distribute for > > macOS? > > Your version would fail to match the behaviour of the official > documentation. > > > _______________________________________________ > gnuplot-bugs mailing list > gnu...@li... > Membership management via: > https://lists.sourceforge.net/lists/listinfo/gnuplot-bugs > |
|
From: Hans-Bernhard B. <HBB...@t-...> - 2025-07-11 17:47:00
|
Am 11.07.2025 um 19:19 schrieb Erik Luijten: > About SAMPLES, I would argue that any plotting program will have to > discreetly sample a function in order to plot it (i.e., I do not view it as > an important point to convey to new users), but I accept your perspective. > That being said, would I cause problems/incompatibilities if I set SAMPLES > to a different value in the precompiled binaries that I distribute for > macOS? Your version would fail to match the behaviour of the official documentation. |
|
From: Erik L. <eri...@gm...> - 2025-07-11 17:19:41
|
Thank you. About the xtics: Mea culpa for not knowing that the default format is "% h". About SAMPLES, I would argue that any plotting program will have to discreetly sample a function in order to plot it (i.e., I do not view it as an important point to convey to new users), but I accept your perspective. That being said, would I cause problems/incompatibilities if I set SAMPLES to a different value in the precompiled binaries that I distribute for macOS? Kind regards, Erik On Fri, Jul 11, 2025 at 11:56 AM Hans-Bernhard Bröker <HBB...@t-...> wrote: > Am 11.07.2025 um 16:58 schrieb Erik Luijten: > > Hi, > > > > I hope this is not sacrilege, but would it be possible to consider > changing > > the default value of SAMPLES in gadgets.h? I understand that this was > set > > to this value in a time when the calculation was costly and screens had > > much lower resolution, but nowadays there doesn't seem to be a good > reason > > to not set it to, say, 500. > > Computational cost is not the only reason. It helps people understand > the fact that the sampling is, in fact, discrete if the first few curves > they see, as absolute newbies, show some visible sampling right off the > bat. It keeps them from forming an incorrect mental image of what this > program will do. > > > Related to that particular demo: I noticed that the values at tics marks > > are not located exactly where one would expect them. > > That depends, as always, on what one expects. I think you'll understand > better if you replace the default tic format with "%+h" and re-do your > exercise. > > > > _______________________________________________ > gnuplot-bugs mailing list > gnu...@li... > Membership management via: > https://lists.sourceforge.net/lists/listinfo/gnuplot-bugs > |
|
From: Hans-Bernhard B. <HBB...@t-...> - 2025-07-11 16:56:36
|
Am 11.07.2025 um 16:58 schrieb Erik Luijten: > Hi, > > I hope this is not sacrilege, but would it be possible to consider changing > the default value of SAMPLES in gadgets.h? I understand that this was set > to this value in a time when the calculation was costly and screens had > much lower resolution, but nowadays there doesn't seem to be a good reason > to not set it to, say, 500. Computational cost is not the only reason. It helps people understand the fact that the sampling is, in fact, discrete if the first few curves they see, as absolute newbies, show some visible sampling right off the bat. It keeps them from forming an incorrect mental image of what this program will do. > Related to that particular demo: I noticed that the values at tics marks > are not located exactly where one would expect them. That depends, as always, on what one expects. I think you'll understand better if you replace the default tic format with "%+h" and re-do your exercise. |
|
From: Erik L. <eri...@gm...> - 2025-07-11 15:04:35
|
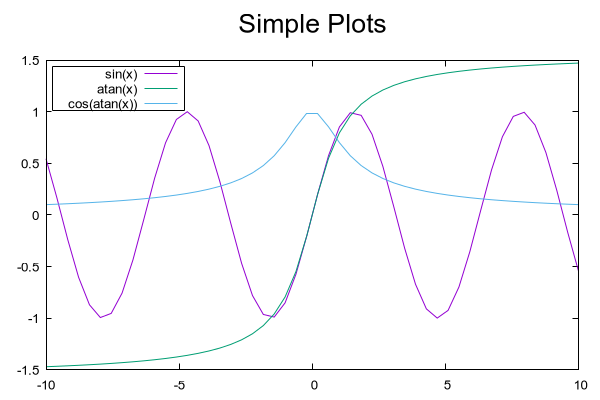
Hi, I hope this is not sacrilege, but would it be possible to consider changing the default value of SAMPLES in gadgets.h? I understand that this was set to this value in a time when the calculation was costly and screens had much lower resolution, but nowadays there doesn't seem to be a good reason to not set it to, say, 500. The effect is absolutely noticeable, see e.g. the first demo on https://gnuplot.sourceforge.net/demo_6.0/simple.html . Of course, it can be overridden in ~/.gnuplot, but the typical novice user is not aware of that, and is needlessly confronted with a low-quality plot of even simple functions. Related to that particular demo: I noticed that the values at tics marks are not located exactly where one would expect them. Take something simple like set xtics font ", 20" plot sin(x) The "0" along the x-axis is not centered around the ticmark. Adding 'center' or 'autojustify' does not fix this. It is visible in different terminals, so I presume it is a setting in term.c? At first, I assumed it was an error on my side, but then I noticed it in https://gnuplot.sourceforge.net/demo_6.0/simple.1.png as well. Apologies if there is a silly oversight on my part. Best, Erik |
|
From: Yury <yur...@gm...> - 2024-03-28 16:21:36
|
Hi, Can't test with other versions right now, but with 5.4.3 and 6.0.0 on linux I'm having an issue plotting this: set terminal x11 ; set size square set xrange [-3:3]; set yrange [-3:3]; set samples 7 sigma = 2.0; f(x,y) = (1/(2*pi*sigma**2)) * exp(-(x**2+y**2)/(2*sigma**2)) ; set grid set pm3d map corners2color c1; splot \ f(x,y) \ AFAIU, this should construct radial-symmetric color map with grid lines separating color changes. What it makes instead on my system is a colormap with an arbitrary number of samples for Y axis. I see at least 8 color changes along Y axis, and generally color rectangles are smaller along Y axis, while grid squares are okay. Is this a known or documented behaviour? -Yury |
|
From: Guy B. <guy...@vi...> - 2024-03-06 14:25:36
|
If I use this script Gnuplot complains with error : ')' expected ### strange behaviour with setting arrays and using stats reset session $Data <<EOD 1 10 2 20 3 30 4 40 EOD stats $Data u (c=$0+1) nooutput # get the number of rows into c array M[c] array M_x_N[c] stats $Data u (M[int($0+1)] = $1) name "M" nooutput stats $Data u (M_x_N[int($0+1)] = $2) name "M_x_N" nooutput ### end of script However, if you change the sequence to the following, it will work. array M[c] stats $Data u (M[int($0+1)] = $1) name "M" nooutput array M_x_N[c] stats $Data u (M_x_N[int($0+1)] = $2) name "M_x_N" nooutput Is this a bug? |
|
From: Ingo T. <ing...@gm...> - 2024-01-29 06:53:52
|
Dear everyone, I have noticed that an old bug concerning object border colors is back in stable version 6.0.0 (dev version not yet tested). All object lines appear black while they have the specified color in gnuplot version 5.4.8 (currently on MacPorts). The error occurs when the linewidth is explicitely specified. A similar (or even the same?) bug appeared in an earlier version of gnuplot 5.*, but I do not remember which exact version it was. Here is a sample script: reset set term x11 size 800,600 set object 1 circle at 0,0 size 3 fs empty border rgb '#ff0000' lw 2.0 set object 2 circle at 0,0 size 6 fs empty border rgb '#0000ff' lw 2.0 plot x Best wishes, Ingo |
|
From: Tatsuro M. <tma...@ya...> - 2022-09-10 09:38:28
|
Sihan You posted to the gnuplot-bug ML [*], However, the gnuplot project does not have any relationship with the conda package manager. So your fault of installing gnuplot by conda package manager does not relate to the gnuplot project and is not a bug for the gnuplot team. [*] Gnuplot bug should be posted to https://sourceforge.net/p/gnuplot/bugs/ but not to the gnuplot-bug Mailing List. Tatsuro ----- Original Message ----- From: "CHENG Sihan" <sih...@ou...> To: "Bug reports for gnuplot" <gnu...@li...>; "Tatsuro MATSUOKA" <tma...@ya...> Date: 2022/09/09 金 23:52 Subject: 回复: [Gnuplot-bugs] install problem with anaconda I said conda install gnuplot. Sihan 发件人: Tatsuro MATSUOKA via gnuplot-bugs <gnu...@li...> 发送时间: 2022年9月9日 16:15 收件人: Bug reports for gnuplot <gnu...@li...> 抄送: Tatsuro MATSUOKA <tma...@ya...> 主题: Re: [Gnuplot-bugs] install problem with anaconda The gnuplot project does not have any relationship with Anaconda. Tatsuro > ----- Original Message ----- > > From: "CHENG Sihan" <sih...@ou...> > To: "gnu...@li..." <gnu...@li...> > Date: 2022/09/09 金 17:55 > Subject: [Gnuplot-bugs] install problem with anaconda > > > Hello, > > I want to install gnuplot with anaconda. I have tried as follows. But it seems that conda cant find the package of gnuplot. > conda config --add channels conda-forge > conda install -c conda-forge gnuplot > conda install -c "conda-forge/label/cf201901" gnuplot > conda install -c "conda-forge/label/cf202003" gnuplo > > PackagesNotFoundError: The following packages are not available from current channels: > > - gnuplot > > Then jow to do it? > Thanks. > > _______________________________________________ > gnuplot-bugs mailing list > gnu...@li... > Membership management via: https://lists.sourceforge.net/lists/listinfo/gnuplot-bugs > _______________________________________________ gnuplot-bugs mailing list gnu...@li... Membership management via: https://lists.sourceforge.net/lists/listinfo/gnuplot-bugs |
|
From: CHENG S. <sih...@ou...> - 2022-09-09 14:52:07
|
I said conda install gnuplot. Sihan ________________________________ 发件人: Tatsuro MATSUOKA via gnuplot-bugs <gnu...@li...> 发送时间: 2022年9月9日 16:15 收件人: Bug reports for gnuplot <gnu...@li...> 抄送: Tatsuro MATSUOKA <tma...@ya...> 主题: Re: [Gnuplot-bugs] install problem with anaconda The gnuplot project does not have any relationship with Anaconda. Tatsuro > ----- Original Message ----- > > From: "CHENG Sihan" <sih...@ou...> > To: "gnu...@li..." <gnu...@li...> > Date: 2022/09/09 金 17:55 > Subject: [Gnuplot-bugs] install problem with anaconda > > > Hello, > > I want to install gnuplot with anaconda. I have tried as follows. But it seems that conda cant find the package of gnuplot. > conda config --add channels conda-forge > conda install -c conda-forge gnuplot > conda install -c "conda-forge/label/cf201901" gnuplot > conda install -c "conda-forge/label/cf202003" gnuplo > > PackagesNotFoundError: The following packages are not available from current channels: > > - gnuplot > > Then jow to do it? > Thanks. > > _______________________________________________ > gnuplot-bugs mailing list > gnu...@li... > Membership management via: https://lists.sourceforge.net/lists/listinfo/gnuplot-bugs > _______________________________________________ gnuplot-bugs mailing list gnu...@li... Membership management via: https://lists.sourceforge.net/lists/listinfo/gnuplot-bugs |
|
From: Tatsuro M. <tma...@ya...> - 2022-09-09 14:15:19
|
The gnuplot project does not have any relationship with Anaconda. Tatsuro > ----- Original Message ----- > > From: "CHENG Sihan" <sih...@ou...> > To: "gnu...@li..." <gnu...@li...> > Date: 2022/09/09 金 17:55 > Subject: [Gnuplot-bugs] install problem with anaconda > > > Hello, > > I want to install gnuplot with anaconda. I have tried as follows. But it seems that conda cant find the package of gnuplot. > conda config --add channels conda-forge > conda install -c conda-forge gnuplot > conda install -c "conda-forge/label/cf201901" gnuplot > conda install -c "conda-forge/label/cf202003" gnuplo > > PackagesNotFoundError: The following packages are not available from current channels: > > - gnuplot > > Then jow to do it? > Thanks. > > _______________________________________________ > gnuplot-bugs mailing list > gnu...@li... > Membership management via: https://lists.sourceforge.net/lists/listinfo/gnuplot-bugs > |
|
From: CHENG S. <sih...@ou...> - 2022-09-09 08:55:14
|
Hello, I want to install gnuplot with anaconda. I have tried as follows. But it seems that conda cant find the package of gnuplot. conda config --add channels conda-forge conda install -c conda-forge gnuplot conda install -c "conda-forge/label/cf201901" gnuplot conda install -c "conda-forge/label/cf202003" gnuplo PackagesNotFoundError: The following packages are not available from current channels: - gnuplot Then jow to do it? Thanks. |
|
From: ZoiDiCabra <ian...@gm...> - 2022-05-04 15:00:47
|
I've opened ticket #2523. Thank you. Ian Em qua., 4 de mai. de 2022 às 03:56, Tatsuro MATSUOKA < tma...@ya...> escreveu: > Bug report to the gnu...@li... is out of date. > Please use the Bug Ticket in https://sourceforge.net/p/gnuplot/bugs/ > > Tatsuro > > > ----- Original Message ----- > > > > From: "ZoiDiCabra" <ian...@gm...> > > To: "gnu...@li..." < > gnu...@li...> > > Date: 2022/05/03 火 23:19 > > Subject: [Gnuplot-bugs] [PATCH] Unreadable zoom-in using dark backgrounds > > > > > > I was doing some experiments with dark mode graphs and realized that the > > zoom selection box is not visible (black on black) in wxt if the > background > > is set to '#000000'. So here's a patch: > > > > diff --git a/src/wxterminal/wxt_gui.cpp b/src/wxterminal/wxt_gui.cpp > > index 20efa9ae3..caac6e2c1 100644 > > --- a/src/wxterminal/wxt_gui.cpp > > +++ b/src/wxterminal/wxt_gui.cpp > > @@ -1088,14 +1088,18 @@ void wxtPanel::DrawToDC(wxDC &dc, wxRegion > ®ion) > > > > #ifdef USE_MOUSE > > if (wxt_zoombox) { > > - tmp_pen = wxPen(wxT("black"), 1, wxPENSTYLE_SOLID); > > - tmp_pen.SetCap( wxCAP_ROUND ); > > - dc.SetPen( tmp_pen ); > > #ifndef __WXOSX_COCOA__ > > /* wx 2.9 Cocoa bug workaround, which has no logical > > functions support */ > > #if (GTK_MAJOR_VERSION < 3) > > + tmp_pen = wxPen(wxT("white"), 1, wxPENSTYLE_SOLID); > > + tmp_pen.SetCap( wxCAP_ROUND ); > > + dc.SetPen( tmp_pen ); > > dc.SetLogicalFunction( wxINVERT ); > > #endif > > +#else > > + tmp_pen = wxPen(wxT("black"), 1, wxPENSTYLE_SOLID); > > + tmp_pen.SetCap( wxCAP_ROUND ); > > + dc.SetPen( tmp_pen ); > > #endif > > dc.DrawLine( zoom_x1, zoom_y1, mouse_x, zoom_y1 ); > > dc.DrawLine( mouse_x, zoom_y1, mouse_x, mouse_y ); > > > > Details: > > system: gnuplot 5.4 patchlevel 3 (Arch Linux) > > patched branch: gnuplot branch-5-4-stable > > > > Testing process: > > > > $ gnuplot -e "set term wxt background '#000000'" -c demo/airfoil.dem > > > > Verified that the zoom selection box is not visible (black on black) > > > > $ gnuplot -e "set term wxt" -c demo/airfoil.dem > > > > Verified that the zoom selection box is visible (black on white). > > > > Patched the file src/wxterminal/wxt_gui.cpp > > > > $ ./src/gnuplot -e "set term wxt background '#000000'" -c > demo/airfoil.dem > > > > Verified that the zoom selection box is now visible (white on black). > > > > ./src/gnuplot -e "set term wxt" -c demo/airfoil.dem > > > > Verified that the zoom selection box is still visible (different blending > > mode though). > > I'm not able to test in a macOS environment. > > > > I can provide screenshots and other details if required > > > > _______________________________________________ > > gnuplot-bugs mailing list > > gnu...@li... > > Membership management via: > https://lists.sourceforge.net/lists/listinfo/gnuplot-bugs > > > > > > _______________________________________________ > gnuplot-bugs mailing list > gnu...@li... > Membership management via: > https://lists.sourceforge.net/lists/listinfo/gnuplot-bugs > |
|
From: Tatsuro M. <tma...@ya...> - 2022-05-04 06:56:38
|
Bug report to the gnu...@li... is out of date. Please use the Bug Ticket in https://sourceforge.net/p/gnuplot/bugs/ Tatsuro > ----- Original Message ----- > > From: "ZoiDiCabra" <ian...@gm...> > To: "gnu...@li..." <gnu...@li...> > Date: 2022/05/03 火 23:19 > Subject: [Gnuplot-bugs] [PATCH] Unreadable zoom-in using dark backgrounds > > > I was doing some experiments with dark mode graphs and realized that the > zoom selection box is not visible (black on black) in wxt if the background > is set to '#000000'. So here's a patch: > > diff --git a/src/wxterminal/wxt_gui.cpp b/src/wxterminal/wxt_gui.cpp > index 20efa9ae3..caac6e2c1 100644 > --- a/src/wxterminal/wxt_gui.cpp > +++ b/src/wxterminal/wxt_gui.cpp > @@ -1088,14 +1088,18 @@ void wxtPanel::DrawToDC(wxDC &dc, wxRegion ®ion) > > #ifdef USE_MOUSE > if (wxt_zoombox) { > - tmp_pen = wxPen(wxT("black"), 1, wxPENSTYLE_SOLID); > - tmp_pen.SetCap( wxCAP_ROUND ); > - dc.SetPen( tmp_pen ); > #ifndef __WXOSX_COCOA__ > /* wx 2.9 Cocoa bug workaround, which has no logical > functions support */ > #if (GTK_MAJOR_VERSION < 3) > + tmp_pen = wxPen(wxT("white"), 1, wxPENSTYLE_SOLID); > + tmp_pen.SetCap( wxCAP_ROUND ); > + dc.SetPen( tmp_pen ); > dc.SetLogicalFunction( wxINVERT ); > #endif > +#else > + tmp_pen = wxPen(wxT("black"), 1, wxPENSTYLE_SOLID); > + tmp_pen.SetCap( wxCAP_ROUND ); > + dc.SetPen( tmp_pen ); > #endif > dc.DrawLine( zoom_x1, zoom_y1, mouse_x, zoom_y1 ); > dc.DrawLine( mouse_x, zoom_y1, mouse_x, mouse_y ); > > Details: > system: gnuplot 5.4 patchlevel 3 (Arch Linux) > patched branch: gnuplot branch-5-4-stable > > Testing process: > > $ gnuplot -e "set term wxt background '#000000'" -c demo/airfoil.dem > > Verified that the zoom selection box is not visible (black on black) > > $ gnuplot -e "set term wxt" -c demo/airfoil.dem > > Verified that the zoom selection box is visible (black on white). > > Patched the file src/wxterminal/wxt_gui.cpp > > $ ./src/gnuplot -e "set term wxt background '#000000'" -c demo/airfoil.dem > > Verified that the zoom selection box is now visible (white on black). > > ./src/gnuplot -e "set term wxt" -c demo/airfoil.dem > > Verified that the zoom selection box is still visible (different blending > mode though). > I'm not able to test in a macOS environment. > > I can provide screenshots and other details if required > > _______________________________________________ > gnuplot-bugs mailing list > gnu...@li... > Membership management via: https://lists.sourceforge.net/lists/listinfo/gnuplot-bugs > |
|
From: ZoiDiCabra <ian...@gm...> - 2022-05-03 14:19:03
|
I was doing some experiments with dark mode graphs and realized that the
zoom selection box is not visible (black on black) in wxt if the background
is set to '#000000'. So here's a patch:
diff --git a/src/wxterminal/wxt_gui.cpp b/src/wxterminal/wxt_gui.cpp
index 20efa9ae3..caac6e2c1 100644
--- a/src/wxterminal/wxt_gui.cpp
+++ b/src/wxterminal/wxt_gui.cpp
@@ -1088,14 +1088,18 @@ void wxtPanel::DrawToDC(wxDC &dc, wxRegion ®ion)
#ifdef USE_MOUSE
if (wxt_zoombox) {
- tmp_pen = wxPen(wxT("black"), 1, wxPENSTYLE_SOLID);
- tmp_pen.SetCap( wxCAP_ROUND );
- dc.SetPen( tmp_pen );
#ifndef __WXOSX_COCOA__
/* wx 2.9 Cocoa bug workaround, which has no logical
functions support */
#if (GTK_MAJOR_VERSION < 3)
+ tmp_pen = wxPen(wxT("white"), 1, wxPENSTYLE_SOLID);
+ tmp_pen.SetCap( wxCAP_ROUND );
+ dc.SetPen( tmp_pen );
dc.SetLogicalFunction( wxINVERT );
#endif
+#else
+ tmp_pen = wxPen(wxT("black"), 1, wxPENSTYLE_SOLID);
+ tmp_pen.SetCap( wxCAP_ROUND );
+ dc.SetPen( tmp_pen );
#endif
dc.DrawLine( zoom_x1, zoom_y1, mouse_x, zoom_y1 );
dc.DrawLine( mouse_x, zoom_y1, mouse_x, mouse_y );
Details:
system: gnuplot 5.4 patchlevel 3 (Arch Linux)
patched branch: gnuplot branch-5-4-stable
Testing process:
$ gnuplot -e "set term wxt background '#000000'" -c demo/airfoil.dem
Verified that the zoom selection box is not visible (black on black)
$ gnuplot -e "set term wxt" -c demo/airfoil.dem
Verified that the zoom selection box is visible (black on white).
Patched the file src/wxterminal/wxt_gui.cpp
$ ./src/gnuplot -e "set term wxt background '#000000'" -c demo/airfoil.dem
Verified that the zoom selection box is now visible (white on black).
./src/gnuplot -e "set term wxt" -c demo/airfoil.dem
Verified that the zoom selection box is still visible (different blending
mode though).
I'm not able to test in a macOS environment.
I can provide screenshots and other details if required
|
|
From: Glenn G. <gd...@zp...> - 2021-09-18 15:29:30
|
Greetings gnuplotters, This question was posted to gnuplot-info about a week ago, but received no response, so re-submitting here as a bug report. Thanks, Glenn Golden ========================================================================= Platform: Arch linux, x86-64 Gnuplot versions: gnuplot-5.2.8-2, gnuplot-5.4.2-1 (both from Arch repo) Gnuplot terminal: x11 Minimal example: gnuplot> set term x11 gnuplot> plot sin(x) gnuplot> unset mouse In 5.2.8, "unset mouse" entirely eliminates the mouse coordinate display region at the bottom of the plot window, and the window then resizes slightly (reduced height) to 'shrink wrap' the remaining plot area. In 5.4.2, "unset mouse" only freezes the coordinate display, but the display region itself remains visible within the plot window (showing the last set of coordinates, frozen) and no resizing of the plot window occurs. I went thru the various mouse options in 5.4.2 to see if perhaps there might have been an option added since 5.2.8 that toggled this behavior, but no joy. Unable to find any option combo that restores the old long- standing behavior, but perhaps I missed it. Can anyone reproduce this? If so, is there some option or other trick that can be used in 5.4.2 that will restore the old behavior? If it's not possible to somehow restore the old behavior with 5.4.2, then please consider this as a bug report (regression against 5.2.8). I am also pretty sure (but cannot easily verify) that the old behavior extended back to at least 4.6.6. Thanks to all for maintaining gnuplot. - gdg ========================================================================= |
|
From: Gabriel D. <gab...@gm...> - 2021-09-12 15:38:09
|
Hello, When I start an interactive session of gnuplot in cmd.exe, I always get the following warning: (process:16512): GLib-GIO-WARNING **: 11:10:26.735: Unexpectedly, UWP app `micro soft.windowscommunicationsapps_16005.14326.20206.0_x64__8wekyb3d8bbwe' (AUMId `m icrosoft.windowscommunicationsapps_8wekyb3d8bbwe!microsoft.windowslive.mail') su pports 1 extensions but has no verbs Gnuplot works fine otherwise, as far as I can tell. I'm using gnuplot 5.4.2 on Windows 10. Any idea what this could be and how to fix it? Regards, Gabriel Dupras |
|
From: <iv...@se...> - 2021-04-25 19:36:40
|
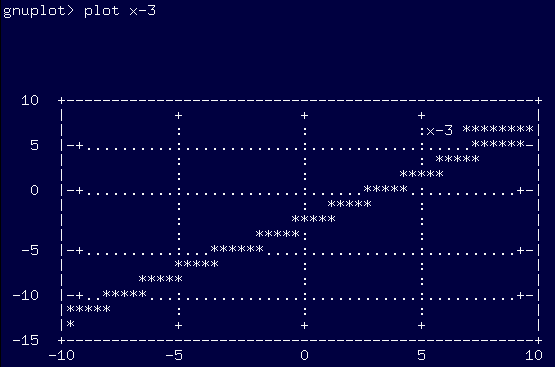
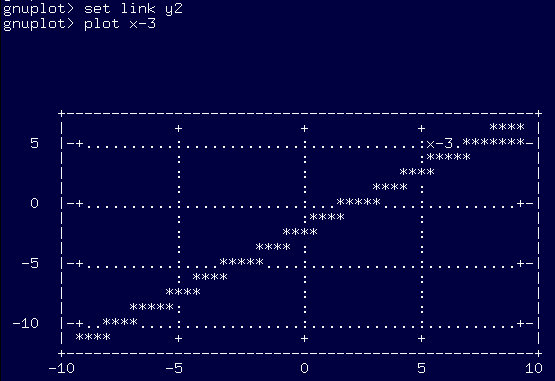
Hi there! I'm not sure weather it's rather a bug or a I didn't catch how to work with. If I link complementary axes, the let-on-gnuplot range becomes cut off to data range. A simple example on a dumb-term: <img src="https://opu.peklo.biz/p/21/04/25/1619378668.png"> <img src="https://opu.peklo.biz/p/21/04/25/1619378695.png"> Any idea how to keep whole-tics autorange with linked axis? Thanks Iva |
|
From: <Sim...@sw...> - 2020-06-22 10:45:56
|
Dear all,

pause -1 "swallows" plots after set terminal x11.

Here is my test script:

show terminal;
plot sin(x);pause -1 "Hit return to continue";
plot sin(x);pause -1 "Hit return to continue";
plot sin(x);pause -1 "Hit return to continue";
plot sin(x);pause -1 "Hit return to continue";
set terminal x11;
show terminal;
plot sin(x);pause -1 "Hit return to continue";
plot sin(x);pause -1 "Hit return to continue";
plot sin(x);pause -1 "Hit return to continue";
plot sin(x);pause -1 "Hit return to continue";

The output:

   terminal type is x11

Hit return to continue
Hit return to continue
Hit return to continue
Hit return to continue

   terminal type is x11  nopersist enhanced

Hit return to continue
Hit return to continueHit return to continue
Hit return to continue

In the part after "set terminal x11" the second plot is "swallowed" (I could not hit return).

Here the information about the versions and COMPILE_OPTIONS:

Linux 4.18.0-193.1.2.el8_2.x86_64 #1 SMP Thu May 7 16:37:54 UTC 2020 x86_64 GNU/Linux

        G N U P L O T
        Version 5.2 patchlevel 8    last modified 2019-12-01

        Copyright (C) 1986-1993, 1998, 2004, 2007-2019
        Thomas Williams, Colin Kelley and many others

        gnuplot home:     http://www.gnuplot.info
        faq, bugs, etc:   type "help FAQ"
        immediate help:   type "help"  (plot window: hit 'h')

    +READLINE  -LIBREADLINE  +HISTORY
    -BACKWARDS_COMPATIBILITY  +OBJECTS  +STATS +EXTERNAL_FUNCTIONS
    +GD_PNG  +GD_JPEG  +GD_TTF  +GD_GIF  +ANIMATION
    -USE_CWDRC  +X11  +X11_EXTERNAL +USE_MOUSE  +HIDDEN3D_QUADTREE

With Gnuplot-4.6.7 (and also 5.2.6) there is no such a problem. I also tried 5.4.rc2 with the same result as with 5.2.8.

Thanks for your help and best regards,

Simon


--
Dr. Simon Lutz
Entwicklungsingenieur / Geodät

Eidgenössisches Departement für Verteidigung,
Bevölkerungsschutz und Sport VBS.
Bundesamt für Landestopografie swisstopo.
Bereich Geodäsie und Eidgenössische Vermessungsdirektion.

Seftigenstrasse 264,
Postfach,
CH-3084 Wabern
Tel +41 58 469 03 90
sim...@sw...<mailto:sim...@sw...>
www.swisstopo.ch<http://www.swisstopo.ch/> / www.cadastre.ch<http://www.cadastre.ch/> / pnac.swisstopo.admin.ch
|
|
From: folkert <fo...@va...> - 2018-12-27 21:43:31
|
Hi, I can reproducible let gnuplot gnuplot-5.0.5+dfsg1 (from debian repo) crash with: - this script: https://keetweej.vanheusden.com/gnuplot/scatter_plot.scr - which uses: https://keetweej.vanheusden.com/gnuplot/scatter_plot.dat The backtrace it gives is: #0 0x00007f31b7cba85b in __GI_raise (sig=sig@entry=6) at ../sysdeps/unix/sysv/linux/raise.c:50 #1 0x00007f31b7ca5535 in __GI_abort () at abort.c:79 #2 0x00007f31b7cfc718 in __libc_message (action=action@entry=do_abort, fmt=fmt@entry=0x7f31b7e0729a "%s\n") at ../sysdeps/posix/libc_fatal.c:181 #3 0x00007f31b7d02e3a in malloc_printerr (str=str@entry=0x7f31b7e0543b "free(): invalid pointer") at malloc.c:5382 #4 0x00007f31b7d06d4e in free_check (mem=<optimized out>, caller=<optimized out>) at hooks.c:254 #5 0x00005650da572403 in do_plot (plots=0x5650db234d20, pcount=pcount@entry=1) at .././../../src/graphics.c:609 #6 0x00005650da592e46 in eval_plots () at .././../../src/plot2d.c:3388 #7 0x00005650da5464b9 in command () at .././../../src/command.c:625 #8 0x00005650da5464b9 in do_line () at .././../../src/command.c:420 #9 0x00005650da54662d in com_line () at .././../../src/command.c:322 #10 0x00005650da536adc in main (argc=0, argv=0x7ffc30bb9188) at .././../../src/plot.c:660 It did not complete writing the svg: https://keetweej.vanheusden.com/gnuplot/scatter_plot.svg Folkert van Heusden -- |
|
From: Hans-Bernhard B. <HBB...@t-...> - 2018-10-26 19:27:01
|
Am 25.10.2018 um 21:38 schrieb Carpenter, Rob: > Hi, > I'm not sure if this is a bug or not. > The behavior of x2tics and linked x axes has changed from 5.0.5 to 5.2.5 > The included pdf files generated from the simple gnu input file illustrates the difference. There are no included PDF files, nor an input file, in the mail that actually went through the list. Attachments usually don't make it. I suggest you re-post this on the bug tracker instead, where you can attach documents. |
|
From: Carpenter, R. <rob...@lm...> - 2018-10-25 19:39:15
|
Hi, I'm not sure if this is a bug or not. The behavior of x2tics and linked x axes has changed from 5.0.5 to 5.2.5 The included pdf files generated from the simple gnu input file illustrates the difference. I desire to have an offset grid for the top axis from the bottom axis, as it shows for 5.0.5. This is not happening for 5.2.5. Is there some setting or command to achieve this now. Also, zoom doesn't work correctly for 5.2.5, as the x2tics labels to not auto configure the frequency anymore, so if you zoom in far enough you will get no x2 labels, yet the x1 labels still work. Can anyone help? Thanks |
|
From: Michael S. <mic...@sy...> - 2018-09-05 07:24:08
|
Dear gnuplot developers, I have found two problems with some example code in the "plot data smooth frequency" section of the manual (page 95 in v5.2, page 90 for v5.0), designed to give equal-width intervals and rectangles whose heights equal each interval frequency: binwidth = <something> # set width of x values in each bin bin(val) = binwidth * floor(val/binwidth) plot "datafile" using (bin(column(1))):(1.0) smooth frequency One problem is minor, one is major. The minor problem is: the histogram bins are centred 0.5*binwidth to the left of where they should be. The definition of "bin()" above replaces each data value with the left endpoint of the interval it lands in, but then centres each interval at that point. To fix the problem, simply replace the definition with bin(val) = binwidth * (floor(val/binwidth) + 0.5) and then each data point is replaced by the midpoint of the interval it lands in. The major problem is: if there are any "empty bins", this code (potentially) generates an incorrect histogram. If any midpoint in the range of the data is not represented in bin(column(1)), this code causes the "smooth frequency" procedure to do the wrong thing. Rather than produce an empty interval at that position, it makes the intervals either side wider (with endpoints halfway between those midpoints that are represented. Worse, the heights of those wider intervals are not adjusted appropriately, so that area no longer reflects frequency in those intervals. I have attached a script and a PDF that it generates to illustrate the problem with a simple example (I have v5.0 on fedora 28) which does show clearly that using "floor()" with "smooth frequency" in this way is problematic. Interestingly, the (experimental) "bins" procedure, documented in the v5.2 manual but not available on my v5.0, ostensibly does the right thing. It may be that you are waiting for "bins" to be no longer "experimental" before making this change, I guess that would make sense. Apologies if this has already been flagged, but I couldn't see it mentioned on the bug tracker page. Cheers, Michael |
|
From: Laurent D. <lau...@gm...> - 2018-04-18 15:10:11
|
HI, as I posted here <https://stackoverflow.com/questions/49763353/gnuplot-how-to-have-only-one-label-of-contour-interval-1-does-ont-work> : I am trying to get a 'contour map' of a function of 2 variables. My problem is that I would like the label to be displayed just once along the contour set (preferably in the middle of the length of the contour). I tried any combination of set cntrparam start n interval m (including <0) but I did not manage to do it (sometimes no label sometimes way too many, but never only one). I need the sample high enough to get a "smooth" figure... I tried with this code: > set isosamples 200,200 > set cntrlabel format start 50 interval -1 font '.7' onecolor > set cntrparam levels discrete > -50,-400,-300,-200,-100,50,20,100,200,300,400,500,0,-20 > set xrange [-5:5] > set yrange [-5:5] > set title "Ensembles de niveaux " > set xlabel " X " > set ylabel "Y " > set contour base > set view map > > splot 4*x**3+4*y**3 with lines lw 3, 4*x**3+4*y**3 with labels point pointinterval -1 > > Someone suggested that it might be a bug. Is it ? Regards, Laurent Bakri |
2173 messages has been excluded from this view by a project administrator.
