
Menu
▾
▴
gnuplot-beta — Developers and beta testers of new gnuplot code
You can subscribe to this list here.
| 2001 |
Jan
|
Feb
(1) |
Mar
|
Apr
|
May
|
Jun
|
Jul
(1) |
Aug
|
Sep
|
Oct
|
Nov
|
Dec
|
|---|---|---|---|---|---|---|---|---|---|---|---|---|
| 2002 |
Jan
(1) |
Feb
|
Mar
|
Apr
|
May
|
Jun
|
Jul
(1) |
Aug
(1) |
Sep
|
Oct
|
Nov
(1) |
Dec
|
| 2003 |
Jan
|
Feb
|
Mar
|
Apr
|
May
|
Jun
|
Jul
(1) |
Aug
(1) |
Sep
|
Oct
(83) |
Nov
(57) |
Dec
(111) |
| 2004 |
Jan
(38) |
Feb
(121) |
Mar
(107) |
Apr
(241) |
May
(102) |
Jun
(190) |
Jul
(239) |
Aug
(158) |
Sep
(184) |
Oct
(193) |
Nov
(47) |
Dec
(68) |
| 2005 |
Jan
(190) |
Feb
(105) |
Mar
(99) |
Apr
(65) |
May
(92) |
Jun
(250) |
Jul
(197) |
Aug
(128) |
Sep
(101) |
Oct
(183) |
Nov
(186) |
Dec
(42) |
| 2006 |
Jan
(102) |
Feb
(122) |
Mar
(154) |
Apr
(196) |
May
(181) |
Jun
(281) |
Jul
(310) |
Aug
(198) |
Sep
(145) |
Oct
(188) |
Nov
(134) |
Dec
(90) |
| 2007 |
Jan
(134) |
Feb
(181) |
Mar
(157) |
Apr
(57) |
May
(81) |
Jun
(204) |
Jul
(60) |
Aug
(37) |
Sep
(17) |
Oct
(90) |
Nov
(122) |
Dec
(72) |
| 2008 |
Jan
(130) |
Feb
(108) |
Mar
(160) |
Apr
(38) |
May
(83) |
Jun
(42) |
Jul
(75) |
Aug
(16) |
Sep
(71) |
Oct
(57) |
Nov
(59) |
Dec
(152) |
| 2009 |
Jan
(73) |
Feb
(213) |
Mar
(67) |
Apr
(40) |
May
(46) |
Jun
(82) |
Jul
(73) |
Aug
(57) |
Sep
(108) |
Oct
(36) |
Nov
(153) |
Dec
(77) |
| 2010 |
Jan
(42) |
Feb
(171) |
Mar
(150) |
Apr
(6) |
May
(22) |
Jun
(34) |
Jul
(31) |
Aug
(38) |
Sep
(32) |
Oct
(59) |
Nov
(13) |
Dec
(62) |
| 2011 |
Jan
(114) |
Feb
(139) |
Mar
(126) |
Apr
(51) |
May
(53) |
Jun
(29) |
Jul
(41) |
Aug
(29) |
Sep
(35) |
Oct
(87) |
Nov
(42) |
Dec
(20) |
| 2012 |
Jan
(111) |
Feb
(66) |
Mar
(35) |
Apr
(59) |
May
(71) |
Jun
(32) |
Jul
(11) |
Aug
(48) |
Sep
(60) |
Oct
(87) |
Nov
(16) |
Dec
(38) |
| 2013 |
Jan
(5) |
Feb
(19) |
Mar
(41) |
Apr
(47) |
May
(14) |
Jun
(32) |
Jul
(18) |
Aug
(68) |
Sep
(9) |
Oct
(42) |
Nov
(12) |
Dec
(10) |
| 2014 |
Jan
(14) |
Feb
(139) |
Mar
(137) |
Apr
(66) |
May
(72) |
Jun
(142) |
Jul
(70) |
Aug
(31) |
Sep
(39) |
Oct
(98) |
Nov
(133) |
Dec
(44) |
| 2015 |
Jan
(70) |
Feb
(27) |
Mar
(36) |
Apr
(11) |
May
(15) |
Jun
(70) |
Jul
(30) |
Aug
(63) |
Sep
(18) |
Oct
(15) |
Nov
(42) |
Dec
(29) |
| 2016 |
Jan
(37) |
Feb
(48) |
Mar
(59) |
Apr
(28) |
May
(30) |
Jun
(43) |
Jul
(47) |
Aug
(14) |
Sep
(21) |
Oct
(26) |
Nov
(10) |
Dec
(2) |
| 2017 |
Jan
(26) |
Feb
(27) |
Mar
(44) |
Apr
(11) |
May
(32) |
Jun
(28) |
Jul
(75) |
Aug
(45) |
Sep
(35) |
Oct
(285) |
Nov
(99) |
Dec
(16) |
| 2018 |
Jan
(8) |
Feb
(8) |
Mar
(42) |
Apr
(35) |
May
(23) |
Jun
(12) |
Jul
(16) |
Aug
(11) |
Sep
(8) |
Oct
(16) |
Nov
(5) |
Dec
(8) |
| 2019 |
Jan
(9) |
Feb
(28) |
Mar
(4) |
Apr
(10) |
May
(7) |
Jun
(4) |
Jul
(4) |
Aug
|
Sep
(4) |
Oct
|
Nov
(23) |
Dec
(3) |
| 2020 |
Jan
(19) |
Feb
(3) |
Mar
(22) |
Apr
(17) |
May
(10) |
Jun
(69) |
Jul
(18) |
Aug
(23) |
Sep
(25) |
Oct
(11) |
Nov
(20) |
Dec
(9) |
| 2021 |
Jan
(1) |
Feb
(7) |
Mar
(9) |
Apr
|
May
(1) |
Jun
(8) |
Jul
(6) |
Aug
(8) |
Sep
(7) |
Oct
|
Nov
(2) |
Dec
(23) |
| 2022 |
Jan
(23) |
Feb
(9) |
Mar
(9) |
Apr
|
May
(8) |
Jun
(1) |
Jul
(6) |
Aug
(8) |
Sep
(30) |
Oct
(5) |
Nov
(4) |
Dec
(6) |
| 2023 |
Jan
(2) |
Feb
(5) |
Mar
(7) |
Apr
(3) |
May
(8) |
Jun
(45) |
Jul
(8) |
Aug
|
Sep
(2) |
Oct
(14) |
Nov
(7) |
Dec
(2) |
| 2024 |
Jan
(4) |
Feb
(4) |
Mar
|
Apr
(7) |
May
(2) |
Jun
(1) |
Jul
|
Aug
(5) |
Sep
|
Oct
|
Nov
(4) |
Dec
(14) |
| 2025 |
Jan
(22) |
Feb
(6) |
Mar
(5) |
Apr
(14) |
May
(6) |
Jun
(11) |
Jul
(19) |
Aug
|
Sep
(17) |
Oct
(1) |
Nov
(2) |
Dec
(18) |
| 2026 |
Jan
|
Feb
|
Mar
(5) |
Apr
|
May
(2) |
Jun
(1) |
Jul
(6) |
Aug
(1) |
Sep
|
Oct
|
Nov
|
Dec
|
|
From: Ethan M. <merritt@u.washington.edu> - 2005-03-29 16:27:22
|
On Tuesday 29 March 2005 12:17 am, Petr Mikulik wrote: > I've just committed a patch which allows > splot x*y with pm3d > anytime. Thus, "set pm3d explicit" is on after gnuplot startup and after > 'reset'. Sounds good. Are you going to do the same for "set contour"? -- Ethan A Merritt merritt@u.washington.edu Biomolecular Structure Center Mailstop 357742 University of Washington, Seattle, WA 98195 |
|
From: Harald H. <h.h...@tu...> - 2005-03-29 16:07:24
|
On Tue, 29 Mar 2005, Hans-Bernhard Broeker wrote: > Ethan Merritt wrote: > > > only the final composite set of all sub-plots. So instead of > > layering, you end up with redundant redrawing of the same final > > composite plot on top of itself. Mmh, why I have not noticed that? > > To do this properly, I think you would need to save each subplot > > to a separate file and emit a corresponding \includegraphics > > statement somewhere in term->suspend() or possibly in term->resume(). Another possibility could be to store everything temporarily and write the 'back' labels of all sub-plots first, then the plots itself and afterwards the 'front' labels. But I believe that this is a too strong modification of gnuplots algorithm. > I'm quite sure that that can't work either --- at the time of a > term->suspend() or term->resume() call, one of the multiple plots is > either completely finished, or hasn't actually been started yet. I.e. an > \includegraphics issued at either of these points would always either > end up with the graphical elements displayed in front of all texts, or > behind all texts, neither of which is any better than the original state > of things. > > I suspect multiplot vs. \includegraphics is a lost cause. It's one of > the situations where the old pslatex terminal's mode of operation with > only one output file (postscript \specials directly interspersed with > the LaTeX output) is a better idea --- even if it's seriously oldfashioned. The main disadvantage is that it does not work with pdflatex and VTeX, for example. But I must admit that I also don't know a satisfactory solution for the problem using \includegraphics, at the moment. -- Harald Harders h.h...@tu... http://www.harald-harders.de |
|
From: Petr M. <mi...@ph...> - 2005-03-29 08:17:42
|
Until now, how you had to type set pm3d; splot x*y with pm3d I've just committed a patch which allows splot x*y with pm3d anytime. Thus, "set pm3d explicit" is on after gnuplot startup and after 'reset'. For compatibility (historical) reasons (color filled pm3d plot combined with mesh line plot): commands "set pm3d;" and "set pm3d at X other_opts;" switch pm3d to "implicit". No change for "set pm3d map" which changes "set style". In rare cases, you may have to add "implicit|explicit" option to your scripts. Actually I wonder whether whether it is needed at all to draw the combined surface mesh + color surface (in one shot)... --- PM |
|
From: Petr M. <mi...@ph...> - 2005-03-29 07:16:59
|
> I've modified gd.trm to support the use of animated gifs to
> store a sequence of plots.
> 	set term gif animate {delay <time>} {noopt$imize}

Could you please also add "loop <n>" option (aka gifsicle) that would make
the animation run n-times (or infinitely for n<=0).

BTW, is it possible to change the delay in between of outputting frames?
(Maybe "set termoption delay ..." would be the right way to achieve this.)

---
PM
|
|
From: Ethan M. <merritt@u.washington.edu> - 2005-03-29 02:27:36
|
On Monday 28 March 2005 05:29 pm, Anthony Gray wrote: > I thought at first that the problem was that my gdfontpath was broken, > and that might still be it, but it appears to be set correctly > (/Library/Fonts). Linking to fonts on the Mac is a little confusing, but > that may be a separate issue for me. Try giving an explicit TTF file name: set term png font "/Library/Fonts/verdana.ttf" 12 If that works, then you need to revisit your font path settings. If it doesn't work, then I think the problem is outside the scope of gnuplot per se. Bad libgd install? Bad libfreetype? > I am using gd 2.0.23, and I have attached the gnuplot long version > below. That's kind of old (though it should work). While you're building new versions of gnuplot you might as well build libgd 2.0.33 as well. > Compile options: > +READLINE -LIBREADLINE +GD_JPEG +GD_TTF > -NOCWDRC +X11 +USE_MOUSE That looks fine. You definitely should be able to get rotated text. -- Ethan A Merritt Biomolecular Structure Center University of Washington 98195-7742 |
|
From: Hans-Bernhard B. <br...@ph...> - 2005-03-28 23:35:27
|
Ethan Merritt wrote: > only the final composite set of all sub-plots. So instead of > layering, you end up with redundant redrawing of the same final > composite plot on top of itself. > To do this properly, I think you would need to save each subplot > to a separate file and emit a corresponding \includegraphics > statement somewhere in term->suspend() or possibly in term->resume(). I'm quite sure that that can't work either --- at the time of a term->suspend() or term->resume() call, one of the multiple plots is either completely finished, or hasn't actually been started yet. I.e. an \includegraphics issued at either of these points would always either end up with the graphical elements displayed in front of all texts, or behind all texts, neither of which is any better than the original state of things. I suspect multiplot vs. \includegraphics is a lost cause. It's one of the situations where the old pslatex terminal's mode of operation with only one output file (postscript \specials directly interspersed with the LaTeX output) is a better idea --- even if it's seriously oldfashioned. -- Hans-Bernhard Broeker (br...@ph...) Even if all the snow were burnt, ashes would remain. |
|
From: Ethan M. <merritt@u.washington.edu> - 2005-03-28 04:29:07
|
I've modified gd.trm to support the use of animated gifs to
store a sequence of plots.
	set term gif animate {delay <time>} {noopt$imize}

libgd version 2.0.29 or newer is required (2.0.33 is recommended).
./configure will auto-detect whether your libgd supports animation.

Sample animations can be viewed from
	http://www.bmsc.washington.edu/people/merritt/gnuplot/
	http://gnuplot.sourceforge.net/demo_4.1/animate.html

The default behaviour is optimized encoding (only store the difference
between successive frames.  Not all viewing programs handle this
properly, however, and in particular if you want to be able to
extract a single frame from the sequence it may be necessary to
specify "nooptimize".


--
Ethan A Merritt
Biomolecular Structure Center
University of Washington 98195-7742
|
|
From: Ethan M. <merritt@u.washington.edu> - 2005-03-26 23:26:16
|
On Tuesday 01 March 2005 02:33 pm, Ethan Merritt wrote:
> In particular I object to the following contamination of core
> routines with terminal-specific code.  If we need a new terminal
> entry for this, then so be it.

It has belatedly occurred to me that this approach has another
problem as well - it breaks in multiplot mode.  Each sub-plot
within the multiplot sequence triggers a repeat call to write
out the {\includegraphics{foo}} statement, and by the time these
are later executed by LaTeX the included file "foo.eps" contains
only the final composite set of all sub-plots.  So instead of
layering, you end up with redundant redrawing of the same final
composite plot on top of itself.

To do this properly, I think you would need to save each subplot
to a separate file and emit a corresponding \includegraphics
statement somewhere in term->suspend() or possibly in term->resume().

Which makes me wonder if the original ugliness can be resolved
without addition of any new terminal API calls, by suitable use of
the existing term->suspend() and term->resume() mechanism.
The PostScript driver proper does not use suspend/resume, but
maybe the merged epslatex/pslatex code should do so.


> having the core code writing this garbage is just really really ugly.
>
> --- gnuplot/src/graphics.c      2005-02-24 12:14:16.000000000 -0800
> +++ gnuplot-cvs/src/graphics.c  2005-03-01 12:49:19.368297032 -0800
> @@ -1482,11 +1482,6 @@
>      /* PLACE ARROWS */
>      place_arrows( 0 );
>
> -    /* Print \includegraphics here when using back option for text */
> -    if (term->name=="epslatex" && gpoutfile)
> -       fprintf(gpoutfile, "    \\put(0,0){\\includegraphics{%s}}%%\n",
> -               pslatex_auxname);
> -
>      /* WORK OUT KEY SETTINGS AND DO KEY TITLE / BOX */
>      if (lkey) {                        /* may have been cancelled if
> something went wrong */ /* just use keybox.xl etc worked out in
> boundary() */
>
--
Ethan A Merritt
Biomolecular Structure Center
University of Washington 98195-7742
|
|
From: Petr M. <mi...@ph...> - 2005-03-25 11:16:24
|
> So I have removed "table" as a terminal type altogether, and replaced
> it with a pair of commands
> 	set table {"outfile"}
> 	...
> 	unset table

Cool.

BTW, I've just found an old mail from a discussion on potential new options
for the table output, if someone wants to add them (some of these options
would shorten the file size):

I think there was somebody proposing some new options for 'set term table'
recently?

The table terminal can be used to save gridded data into a file. Then it
would be convenient to strip the comments and the last column with flags.
Even though it is possible to parse the output file via an awk script, I
think that the following built-in options could be useful:

set term table [[no]com$ments] [space | tab | separator "xx"] [ [[no]u]
[[no]i] [[no]o] [[no]flag]

current definition is: set term table comments space u i o flag

(*) nocomments - don't write comments to the output file
(*) tab - separate columns by \t instead of single space
(*) i, o, u - write data points which are in, out, undef
(*) noi, noo, nou - don't write data points which are in, out, undef
(*) [no]flag - [don't] write the last column with the u,i,o flag
|
|
From: <dan...@ie...> - 2005-03-25 06:15:47
|
> As a result of this change, vector.dem now works for all terminal types > and also works from non-interactive scripts. So I have added it back > to all.dem and 'make check'. That's nice. No longer that odd file floating about then. Dan |
|
From: Ethan M. <merritt@u.washington.edu> - 2005-03-25 05:32:12
|
On Tuesday 22 March 2005 05:46 am, Hans-Bernhard Broeker wrote:
> Ethan Merritt wrote:
> > I want to plot a contour map with several explicit paths
> > superimposed on it.
>
> .. you didn't mention the usually recommended method: doing it via 'set
> term table' to put the contours into a file, then plotting that along
> with whatever else you want, in a single 'splot' or 'plot' commands.

I didn't mention it because it doesn't work in general, and has never
worked in general. It works only if the current terminal is both
interactive and stateless.  The sequence
	set term push; set term table; plot ...; set term pop;
trashes the original terminal state and the output file state.

That's why we haven't been able to include vector.dem in  `make check`
and why that demo doesn't work for most terminals in the first place.

It makes no sense for the tabular output to be considered as a
terminal type anyhow. The core code makes not a single call to the
dummied-up terminal driver entries.

So I have removed "table" as a terminal type altogether, and replaced
it with a pair of commands
	set table {"outfile"}
	...
	unset table

This allows you to dump tabular output without perturbing the current
terminal state. If no explicit outfile is given, the tabular output goes
to gpoutfile. As a sop to backwards compatibility, the command
'set term table' is trapped and translated to 'set table'.
This doesn't make old scripts work any better than before, but if you
did have a working script then it should continue to work. However,
it will work better if you upgrade it to use the new commands instead
of fooling with the terminal type.

As a result of this change, vector.dem now works for all terminal types
and also works from non-interactive scripts.  So I have added it back
to all.dem and 'make check'.

There is still some minor cleanup work needed to remove table.trm
from the configuration and make files.  Otherwise I think this turned
out to be a straightforward fix for a longstanding problem.

--
Ethan A Merritt
Biomolecular Structure Center
University of Washington 98195-7742
|
|
From: Ethan M. <merritt@u.washington.edu> - 2005-03-23 19:02:12
|
On Tuesday 22 March 2005 01:01 pm, Aapo Lankinen wrote: > > Nevermind, I figured it out myself. In the logarithmic mode of the > contour PM3D-plot there is two subsequent log10():s of the z-coordinate > of the legend, which effectively renders the legend line samples to the > same colour. I removed the other de-log, and following patch fixes the > problem at least for me. :-) Thanks. Applied in cvs. -- Ethan A Merritt merritt@u.washington.edu Biomolecular Structure Center Mailstop 357742 University of Washington, Seattle, WA 98195 |
|
From: <dan...@ie...> - 2005-03-23 17:51:03
|
>> I suppose it's a bug, although I honestly don't know what the >> expected behaviour would be. If you start a contour series with >> a fixed linetype then it auto-increments line types (colors) for >> successive contour levels, right? But if you start it off with >> an arbitrary color, as you did with 'lc rgb "#foo"', then how >> should it determine the color of the next contour level? > > I think it should not cycle colors at all, and stay with the same color > (aka > "unset clabel"). I agree. My guess is few will intend to control individual colors of the contour. Perhaps someone would want all the negative level curves in one color and all the positive level curves in another color. Dan |
|
From: <dan...@ie...> - 2005-03-23 17:45:21
|
> Igor Bray wrote: > > [CC'ing this to -beta, because this is not a bug but a feature proposal= .] > >> modifying the graphics.c file in the way that is listed below. I had >> hoped that the latest version of gnuplot would give me the required >> capacity, but I don't believe it does. > > Unfortunately, the patch, as attached, is quite unusable --- version > 3.7.1 is 3 release versions, or 7 years out of date; and the patch > itself is backwards. > > To first approximation, I agree with the reasoning of that patch: > 'set key spacing <sp>' really should affect the line spacing of the key > title, too. > > Could you please try to re-do this patch, based on the current CVS > sources, and post it to the patches tracker? I've written a key patch for enhanced placement that I think is fairly clean and "decruftifies" the layout a little bit. Before writing a conflicting patch, please try that patch and see if we can build off of it. Dan |
|
From: Petr M. <mi...@ph...> - 2005-03-23 14:29:56
|
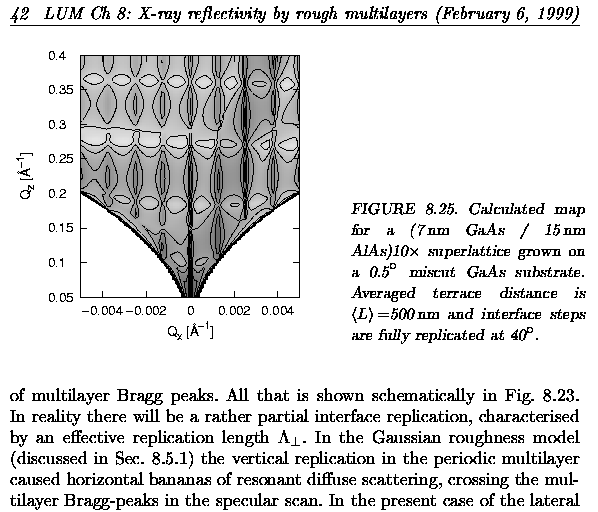
> Yes, probably a better keyword. Getting back to a previous discussion, > without auto-labelling of the level curves, the contour plot with a single > color is difficult to interpret. Well, it is probably still of some use > for judging overall characteristics of the function. Probably looks nice > too. I've already used a pm3d map (gray) with black contour lines over it: http://www.sci.muni.cz/~mikulik/figs/gp-pm3d-LuminyFig825.gif In figure captions of such figures, it is sufficient to say "contour levels are half a decade of intensity". --- PM |
|
From: Petr M. <mi...@ph...> - 2005-03-23 08:52:58
|
> If what you want is to have all contours the same color, > then the obvious syntax would be something like > set contour samecolor > > although surely there must be a better keyword. >No "would be" needed --- this already exists, and it's called > > unset clabel Wow, I never used that! That's even not in any demo! >Yes, that *is* definitely one of the top two contestants of most silly >option name in all of gnuplot --- the other being 'set ticslevel'. Indeed! > > set contour > > set cntrpar levels 30 > > splot x*x-y*y with line lc rgb "#000000" > > splot x*x-y*y with line lc rgb "#000000" > > > > but it uses the whole color palette instead of a single color. Bug? > > I suppose it's a bug, although I honestly don't know what the > expected behaviour would be. If you start a contour series with > a fixed linetype then it auto-increments line types (colors) for > successive contour levels, right? But if you start it off with > an arbitrary color, as you did with 'lc rgb "#foo"', then how > should it determine the color of the next contour level? I think it should not cycle colors at all, and stay with the same color (aka "unset clabel"). Strange -- in this script, the bug shows up again: set contour set cntrpar levels 30 unset clabel splot x*x-y*y with line lt 1 splot x*x-y*y with line lc rgb "#000000" --- PM |
|
From: Petr M. <mi...@ph...> - 2005-03-23 08:43:27
|
> Could please somebody close the patch #743667, Epslatex term merged w/ > pslatex/pstex, which is obsolete? Done. |
|
From: Ethan M. <merritt@u.washington.edu> - 2005-03-23 06:20:36
|
On Tuesday 22 March 2005 11:15 am, Aapo Lankinen wrote: > > ---- clip ---- > unset surface > set contour > set logscale z > set palette model HSV functions gray, gray, 1.0-0.5*gray > set log cb > unset colorbox > set cntrparam levels 30 > set view 0,0 > splot x**2+y**2+1.0 palette > ---- clap ---- > > all the contour label lines in the legend have the same colour > as the maximum intensity contour line. > Can someone confirm? I confirm there's a bug. When cb is in logscale, the axis limits CB_AXIS.min and CB_AXIS.max are stored as the log of the limit value. But the function cb2gray(val) checks val itself against the limits, rather than checking log(val). Unfortunately, changing it to log(val) inside cb2gray does not produce the correct contour coloring either. So there must be additional problems. There's ongoing discussion of revising the contouring code anyhow, so maybe someone will spot the correct fix while revising it for other reasons. -- Ethan A Merritt Biomolecular Structure Center University of Washington 98195-7742 |
|
From: Harald H. <h.h...@tu...> - 2005-03-22 21:22:33
|
Could please somebody close the patch #743667, Epslatex term merged w/ pslatex/pstex, which is obsolete? Regards Harald -- Harald Harders h.h...@tu... http://www.harald-harders.de |
|
From: Aapo L. <aap...@gm...> - 2005-03-22 21:02:05
|
On Tue, 2005-03-22 at 21:15 +0200, Aapo Lankinen wrote:
> Hi!
>
> I noticed something strange using Gnuplot 4.1 CVS (and Gnuplot 4.0,
> too): the following commands
>
> ---- clip ----
> unset surface
> set contour
> set logscale z
> set palette model HSV functions gray, gray, 1.0-0.5*gray
> set log cb
> unset colorbox
> set cntrparam levels 30
> set view 0,0
> splot x**2+y**2+1.0 palette
> ---- clap ----
>
> draw nice coloured contours as you would expect, but the the contour
> labels in the legend are of wrong colour - all the contour label lines
> in the legend have the same colour as the maximum intensity contour
> line.  However, the contour label numerical values seem to be correct in
> the legend.  This happens with at least x11 and postscript terminals.
> I'm using Debian i386 GNU/Linux (Sarge).  Can someone confirm?


Nevermind, I figured it out myself.  In the logarithmic mode of the
contour PM3D-plot there is two subsequent log10():s of the z-coordinate
of the legend, which effectively renders the legend line samples to the
same colour.  I removed the other de-log, and following patch fixes the
problem at least for me.  :-)  I hope it does not cause any other
unexpected problems.  Can someone check if it's safe?  I don't know
anything about Gnuplot except reading the source for an hour :-)
Maybe someone could perhaps apply it to the CVS, if it indeed does work
for others?  (diff for contour.c below and attached)

                                                        Aapo


--- contour.c   2005-03-22 22:07:26.589004130 +0200
+++ contour.c   2005-03-22 22:08:12.726777705 +0200
@@ -247,7 +247,7 @@
            contour_list->isNewLevel = 1;
            sprintf(contour_list->label, contour_format,
AXIS_DE_LOG_VALUE(FIRST_Z_AXIS,z));
 #ifdef PM3D
-           contour_list->z = AXIS_DE_LOG_VALUE(FIRST_Z_AXIS, z);
+           contour_list->z = z;
 #endif
        }
     }


--
Aapo Lankinen <aap...@gm...>
|
|
From: Ethan M. <merritt@u.washington.edu> - 2005-03-22 20:50:26
|
On Tuesday 22 March 2005 08:26 am, Petr Mikulik wrote: > > splot 'file' with contours > Or > splot 'file' contours with line ... Do you ever need to plot contours with something other than lines? I know it is currently possible to do set contour; splot "foo" with impulses There's even a special routine for it cntr3d_impulses() but I can't figure out why you'd ever want to do this. -- Ethan A Merritt merritt@u.washington.edu Biomolecular Structure Center Mailstop 357742 University of Washington, Seattle, WA 98195 |
|
From: <dan...@ie...> - 2005-03-22 19:53:49
|
> On Tuesday 22 March 2005 08:26 am, Petr Mikulik wrote: >> I wish also an option "samecolor" or whatever... even I have tried: >> >> set contour >> set cntrpar levels 30 >> splot x*x-y*y with line lc rgb "#000000" >> splot x*x-y*y with line lc rgb "#000000" >> >> but it uses the whole color palette instead of a single color. Bug? > > I suppose it's a bug, although I honestly don't know what the > expected behaviour would be. If you start a contour series with > a fixed linetype then it auto-increments line types (colors) for > successive contour levels, right? But if you start it off with > an arbitrary color, as you did with 'lc rgb "#foo"', then how > should it determine the color of the next contour level? > > If what you want is to have all contours the same color, > then the obvious syntax would be something like > set contour samecolor > > although surely there must be a better keyword. Yes, probably a better keyword. Getting back to a previous discussion, without auto-labelling of the level curves, the contour plot with a singl= e color is difficult to interpret. Well, it is probably still of some use for judging overall characteristics of the function. Probably looks nice too. Dan |
|
From: Hans-Bernhard B. <br...@ph...> - 2005-03-22 19:48:00
|
Ethan Merritt wrote: > If what you want is to have all contours the same color, > then the obvious syntax would be something like > set contour samecolor No "would be" needed --- this already exists, and it's called unset clabel Yes, that *is* definitely one of the top two contestants of most silly option name in all of gnuplot --- the other being 'set ticslevel'. |
|
From: Ethan M. <merritt@u.washington.edu> - 2005-03-22 19:42:36
|
On Tuesday 22 March 2005 08:26 am, Petr Mikulik wrote:
> I wish also an option "samecolor" or whatever... even I have tried:
>
> set contour
> set cntrpar levels 30
> splot x*x-y*y with line lc rgb "#000000"
> splot x*x-y*y with line lc rgb "#000000"
>
> but it uses the whole color palette instead of a single color. Bug?

I suppose it's a bug, although I honestly don't know what the
expected behaviour would be.  If you start a contour series with
a fixed linetype then it auto-increments line types (colors) for
successive contour levels, right?  But if you start it off with
an arbitrary color, as you did with 'lc rgb "#foo"', then how
should it determine the color of the next contour level?

If what you want is to have all contours the same color,
then the obvious syntax would be something like
    set contour samecolor

although surely there must be a better keyword.

--
Ethan A Merritt       merritt@u.washington.edu
Biomolecular Structure Center
Mailstop 357742
University of Washington, Seattle, WA 98195
|
|
From: Aapo L. <aap...@gm...> - 2005-03-22 19:16:17
|
Hi! I noticed something strange using Gnuplot 4.1 CVS (and Gnuplot 4.0, too): the following commands ---- clip ---- unset surface set contour set logscale z set palette model HSV functions gray, gray, 1.0-0.5*gray set log cb unset colorbox set cntrparam levels 30 set view 0,0 splot x**2+y**2+1.0 palette ---- clap ---- draw nice coloured contours as you would expect, but the the contour labels in the legend are of wrong colour - all the contour label lines in the legend have the same colour as the maximum intensity contour line. However, the contour label numerical values seem to be correct in the legend. This happens with at least x11 and postscript terminals. I'm using Debian i386 GNU/Linux (Sarge). Can someone confirm? Aapo -- Aapo Lankinen <aap...@gm...> |
28 messages has been excluded from this view by a project administrator.

