
Menu
▾
▴
1 Attachments
#392 Some way to write out delta-time
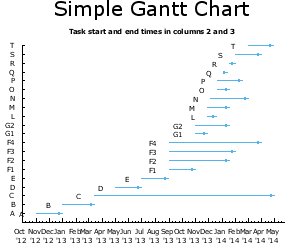
Consider the Gantt chart demo
http://gnuplot.sourceforge.net/demo_cvs/gantt.html
If you run this demo in table mode ("set table") you get the following nonsense:
# Curve 0 of 2, 20 points
# Curve title: "$DATA using (T(2)) : ($0) : (T(3)-T(2)) : (0.0) : yticlabel(1)"
# x y delta_x delta_y type
"Nov '12"  0 "Mar '70"  0  i
"Jan '13"  1 "Mar '70"  0  i
"Mar '13"  2 "Feb '71"  0  i
"May '13"  3 "Mar '70"  0  i
"Jul '13"  4 "Mar '70"  0  i
"Sep '13"  5 "Mar '70"  0  i
"Sep '13"  6 "May '70"  0  i
The first bit really is the start date, so that's OK, but column 3 onward is supposed to be an elapsed time, not a date. "Mar '70" really means "some time interval between 2 and 3 months in length". The program should know this is an incremental time rather than an absolute time because the plot style is "with vector". But there is no way to pass it an appropriate time format like "%j:%H:%M:%.3S" that would give an elapsed time in days+hours+minutes+seconds.


Diff: