Menu
▾
▴
#1020 Certain debugger features not working in Codeblocks 20.03: "gdborig.exe" crash
Hello! I am a new C programmer and new to CodeBlocks, only using it for about 2 months or so...
Recently I learned debugging in CodeBlocks, but I was surprised to see that certain features of debugging such as "Next Instruction" and "CPU Registers" don't have expected behaviour and cause the debugging process to terminate, with this 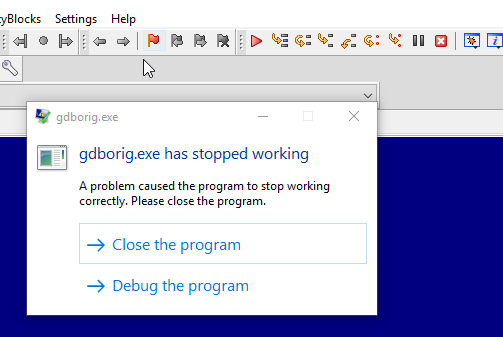
Since my CodeBlocks installation was about 2 months old, I thought this crash was probably happening due to some corrupt executable/wrong compiler/debugger directories.
But installing CodeBlocks 20.03 from the "codeblocks-20.03mingw-setup.exe " compiled binary from codeblocks.org onto a fresh, brand-new installation of Windows 10 LTSB(on a VM) causes the exact same behaviour.
Possible Bug
Environment: Windows 10 LTSB x64 running on Intel i5-3470, 8GB RAM, Running Codeblocks 20.03 64-bit
Expected behaviour: ** All features of the debugger should work as expected, for example, "Next Instruction" should jump to the next comma/semi-colon seperated statement in the source code.
Actual behaviour: Upon clicking said feature, for example, "Next Instruction" or "CPU Registers", causes nothing to happen, but instead creates a window stating "gdborig.exe" has crashed.
Replication:** An attempt to replicate this behaviour on a VM was possible. Possible while attempting to preserve initial conditions, works while attempting to debug this sample.
#include <stdio.h>
#include <stdlib.h>
int main()
{
  char loop;
  puts("Presenting the alphabet:");

  for(loop='A';loop<='Z';loop++)
    putchar(loop);
  return 0;
}
In general, this behaviour is occuring on any and all code samples.
I was initially going to post this in the forums as it is possibly a configuration error and not a bug, but I couldn't create a forum account: even though I was inputting the correct answers to the anti-spam captchas, and the captcha verified my answer as correct(green tick symbol), the forum did not let me create an account as it reported the captcha said my answers were wrong.
I hope this bug gets fixed as I wish to soon get started on learning debugging and all that CodeBlocks and gdb has to offer. Feel free to ask for more information. Thanks in advance.

Full Debug Log from "Debugger" Tab in 'Logs & Others'
Happens when clicking on "Next Instruction"
I thought this might be important as normally an assembler dump like this is not generated in the logs when the debugger works normally...
Last edit: AbdullahTrees 2020-09-25
This is a known problem. It turned out that the gdb in the mingw-w64 release we're shipping is not really stable. Try to find newer release. If it still doesn't work try to report this to mingw-w64 people.
Is it then possible to package an older but stable version of mingw-w64? Also I'd love to try out newer versions of mingw-w64, but the package is super complicated to install/download for new people(like me). One of the key attractive points about CodeBlocks is how easy it is to use compared to traditional cmd-line compiling and debugging.
Not before we know if there is a working version. I don't use windows, so I cannot help in this regard unfortuantely.
how can we know
@David Lucky What do you want to know? If the debugger works? Install a new version and tell us.
I can confirm that gdb version 8.1 is not functional, at least with Code::Blocks 20.03 . I regressed to gdb 8.0.1 and it seems to work. I found gdb 8.0.1 in the 7.2.0 version of mingw-w64.
gdb 8.1 in mingw-w64 8.1.0 and 7.3.0
gdb 8.0.1 in mingw-w64 7.2.0
gdb 8.0 in mingw-w64 7.1.0 and 6.4.0
Download MinGW-W64-Install from https://sourceforge.net/projects/mingw-w64/files/ and run it to choose the file set you want installed. Point C::B at the gdb.exe file. Verify your debugger version by just running gdb.exe or watching the Debugger window in C::B.
A very quick debug of version 8.1 gives me an access violation.
Update**
I installed C::B 20.03 on a different computer, and gdb v8.1 works. Both computers are Win 10 x64 but the one that works is older ver1909 on amd, while the one that doesn't work is ver2004 on intel. Both have had versions of Visual Studio/Python installed. It appears that gdb.exe is sensitive to the environment, which is bad. Finding out the system state that gdb is reacting to won't be easy. At least there is a work around by using an older version.
Last edit: Chris Whitehead 2021-01-15
I have been able to upgrade GDB to 10.2.90 using the package downloaded from the link below and have successfully used the "Next Instruction" and been able to show the CPU register dialog without any crashes in a simple 10 minute test.
Main page: https://github.com/ssbssa/gdb/releases
File Tested: https://github.com/ssbssa/gdb/releases/download/gdb-10.2.90.20210425/gdb-10.2.90.20210425-i686.7z
NOTE: The python download did not run due to python issues, which I did not investigate.
The installer changes in ticket 117 may effectively resolve this until MinGW is updated to include a later GDB.. See the compiler installation page in the installer executable.
Nice to know that a working GDB version exists,
Do I have to install this GDB version myself or has the CodeBlocks installer been updated
You need to manually install it yourself.
See ticket 1119 changes as the installer has an option to download a later GDB that will resolve this crash if it is done by the end user. So the work around for this is in the windows installer changes as per 1119.