WSN Graphic Tool è uno strumento grafico che permette di testare e valutare algoritmi implementati su reti di sensori wireless. Genera animazioni e statistiche di algoritmi simulati con TOSSIM ed implementati su piattaforma TinyOS.
Features
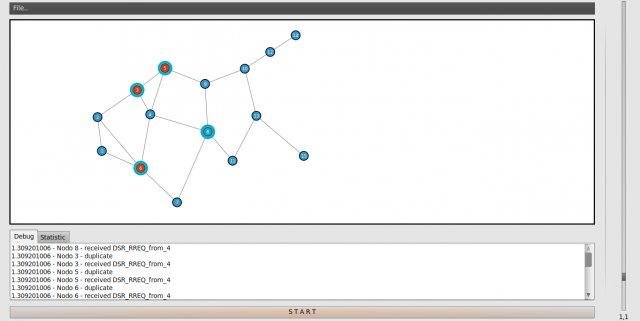
- Visualizzazione grafica di topologie di WSN.
- Animazione di algoritmi di routing.
- Statistiche sui pacchetti inviati, ricevuti e duplicati in tempo reale.
Project Samples


License
Other LicenseFollow Graphic tool for Wireless Sensor Network
Other Useful Business Software
Our Free Plans just got better! | Auth0
You asked, we delivered! Auth0 is excited to expand our Free and Paid plans to include more options so you can focus on building, deploying, and scaling applications without having to worry about your security. Auth0 now, thank yourself later.
Rate This Project
Login To Rate This Project
User Reviews
Be the first to post a review of Graphic tool for Wireless Sensor Network!
