kartograph.js is an unmaintained open-source JavaScript library that renders interactive SVG maps in browsers, using jQuery and RaphaelJS. Originating from Kartograph.py, it supports map loading, stylable layers, choropleth maps, symbol overlays (e.g., bubbles), and allows chunked rendering for complex maps.
Features
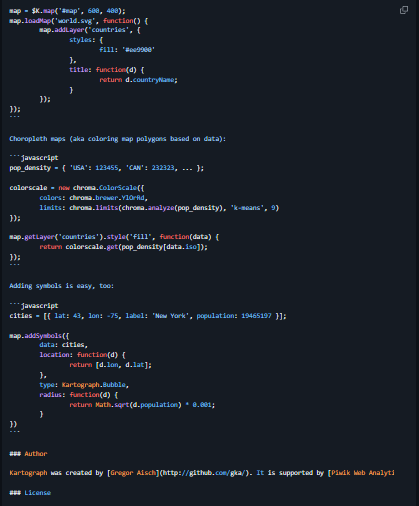
- Load and render SVG maps via map.loadMap()
- Add stylable layers and rename them dynamically
- Choropleth support: style based on data attributes
- Add symbols like bubbles with scaled radii
- Option for chunked layer rendering to avoid blocking
- LGPL‑licensed, lightweight with minimal dependencies
Project Samples
Categories
LibrariesLicense
GNU Library or Lesser General Public License version 3.0 (LGPLv3)Follow Kartograph.js
Other Useful Business Software
Our Free Plans just got better! | Auth0
You asked, we delivered! Auth0 is excited to expand our Free and Paid plans to include more options so you can focus on building, deploying, and scaling applications without having to worry about your security. Auth0 now, thank yourself later.
Rate This Project
Login To Rate This Project
User Reviews
Be the first to post a review of Kartograph.js!