pgfplots-features Mailing List for pgfplots (Page 4)
Brought to you by:
cfeuersaenger,
ludewich
This list is closed, nobody may subscribe to it.
| 2009 |
Jan
|
Feb
|
Mar
(20) |
Apr
(5) |
May
(7) |
Jun
(15) |
Jul
(15) |
Aug
(17) |
Sep
(22) |
Oct
(3) |
Nov
(8) |
Dec
(6) |
|---|---|---|---|---|---|---|---|---|---|---|---|---|
| 2010 |
Jan
(22) |
Feb
(19) |
Mar
(14) |
Apr
(24) |
May
(18) |
Jun
(23) |
Jul
(18) |
Aug
(10) |
Sep
(33) |
Oct
(11) |
Nov
(12) |
Dec
|
| 2011 |
Jan
(16) |
Feb
(9) |
Mar
(10) |
Apr
(17) |
May
(2) |
Jun
(11) |
Jul
(29) |
Aug
(12) |
Sep
(20) |
Oct
(9) |
Nov
(8) |
Dec
(17) |
| 2012 |
Jan
(17) |
Feb
(6) |
Mar
(9) |
Apr
(8) |
May
(1) |
Jun
(3) |
Jul
(4) |
Aug
(15) |
Sep
(7) |
Oct
(9) |
Nov
(25) |
Dec
(2) |
| 2013 |
Jan
(7) |
Feb
|
Mar
(4) |
Apr
(1) |
May
(3) |
Jun
(15) |
Jul
(2) |
Aug
(2) |
Sep
(1) |
Oct
(4) |
Nov
|
Dec
(2) |
| 2014 |
Jan
(4) |
Feb
(1) |
Mar
(17) |
Apr
(6) |
May
|
Jun
(2) |
Jul
(6) |
Aug
(3) |
Sep
(3) |
Oct
(4) |
Nov
(4) |
Dec
(4) |
| 2015 |
Jan
|
Feb
(3) |
Mar
|
Apr
|
May
(2) |
Jun
|
Jul
|
Aug
(2) |
Sep
(4) |
Oct
(1) |
Nov
|
Dec
|
| 2016 |
Jan
(3) |
Feb
|
Mar
|
Apr
|
May
|
Jun
|
Jul
|
Aug
(2) |
Sep
|
Oct
(3) |
Nov
|
Dec
(1) |
| 2017 |
Jan
|
Feb
|
Mar
|
Apr
|
May
|
Jun
(1) |
Jul
|
Aug
|
Sep
|
Oct
|
Nov
|
Dec
|
| 2018 |
Jan
|
Feb
|
Mar
|
Apr
(1) |
May
|
Jun
|
Jul
|
Aug
|
Sep
|
Oct
(9) |
Nov
(1) |
Dec
|
| 2019 |
Jan
(4) |
Feb
(1) |
Mar
(1) |
Apr
|
May
|
Jun
|
Jul
|
Aug
|
Sep
|
Oct
|
Nov
|
Dec
|
|
From: Philipp A. <fly...@we...> - 2014-03-20 10:59:47
|
hi, i have a picture that uses a diverging color map. but minimum and maximum don’t have the same absolute value (but -0.2 and +0.5 instead) i want to be able to do a centered color map, where “0” is the middle color, all points >0 use the upper half of the map, and all <0 the lower half. the color bar should be skewed according to the real values (i.e. the lower half of the map should take up 2/7 of the bar,a nd the upper half the remaining 5/7) maybe a point meta center=[auto,<scalar>] key, with auto meaning a calculated value of (point meta max + point meta min) ÷ 2 best, philipp |
|
From: Philipp A. <fly...@we...> - 2014-03-20 10:51:28
|
Hi,

\addplot graphics internally tries to use \includegraphics even on ConTeXt

this can be fixed by defining

\def\includegraphicscompat[#1]#2{\externalfigure[#2][#1]}

and setting

includegraphics cmd=\includegraphicscompat

on ConTeXt. It should be done by PGF Plots automatically

best, philipp
|
|
From: Christian F. <cfe...@go...> - 2014-03-19 21:16:35
|
Hi Ihor,

this is effectively the same problem as with the text depth: the legend
style is inherited by your plot mark.

The only way to solve it is to set all involved options explicitly. In
this case, the option "anchor=center" fixes the problem:

\pgfdeclareplotmark{e}
   {\filldraw[fill=white,draw=black] (0pt,0pt) circle [radius=3pt]
     node[anchor=center,text depth=0pt] {\scriptsize e};}


Kind regards

Christian

Am 19.03.2014 18:09, schrieb Ihor Rokach:
> Dear Christian,
>
> Thank you very much for your very kind answer. After your correction
> everything is OK with my plot until any kind of horizontal alignment
> of the legend is used. Unfortunately, either "legend cell align=left"
> (used in the example below) or "legend cell align=right" shifts letter
> 'e' out of the circle in the legend. I have tried to control letter
> 'e' position using 'align=' key of the node in pgfdeclareplotmark
> without any success. Is it a bug or (very advanced) feature?
>
> \documentclass[tikz]{standalone}
> \usepackage{pgfplots}
> \pgfplotsset{compat=newest}
>
> \pgfdeclareplotmark{e}
> {\filldraw[fill=white,draw=black] (0pt,0pt) circle [radius=3pt]
>     node[text depth=0pt] {\scriptsize e};}
>
> \begin{document}
> \thispagestyle{empty}
> \begin{tikzpicture}
> \begin{axis}[legend cell align=left] %% alignment of the legend
>  \addplot[mark=e] coordinates {(0,1) (1,0)};
>     \addlegendentry{test}
> \end{axis}
> \end{tikzpicture}
> \end{document}
>
> With best wishes
> ,
> =========
> I
> hor
>
>
> ------------------------------------------------------------------------------
> Learn Graph Databases - Download FREE O'Reilly Book
> "Graph Databases" is the definitive new guide to graph databases and their
> applications. Written by three acclaimed leaders in the field,
> this first edition is now available. Download your free book today!
> http://p.sf.net/sfu/13534_NeoTech
>
>
> _______________________________________________
> Pgfplots-features mailing list
> Pgf...@li...
> https://lists.sourceforge.net/lists/listinfo/pgfplots-features
|
|
From: Christian F. <cfe...@go...> - 2014-03-19 21:14:10
|
Dear Rufus Wilson,

this sounds like a bug: both packages struggle to overwrite the \label
functionality, and only one of them succeeds.

The following workaround compiles and appears to work. Could you verify
that it does what you intend to do?

\documentclass[11pt]{beamer}
\usepackage[latin1]{inputenc}
\usepackage{tikz}
\usepackage{pgfplots}
\usepackage{animate}

\let\XXXlabel=\label
\begin{document}
\begin{frame}
\frametitle{mwe}
\begin{animateinline}[]{3}
\multiframe{4}{iIdPic=1+1}{
\begin{tikzpicture}[scale=0.6]
\let\label=\XXXlabel
\begin{axis}[ytick=\empty,xmin=0,xmax=5,hide x axis]
\addplot+[mark=none] {3*x+\iIdPic};
\label{Temp\iIdPic}
\end{axis}
\end{tikzpicture}
}
\end{animateinline}
\end{frame}
\end{document}

If so, I can think of a workaround in the pgfplots package.

Kind regards

Christian


Am 18.03.2014 19:47, schrieb Rufus Wilson:
> Dear Dr Feuersanger,
>
> I have encountered a bug when using pgfplots with the animate package.
> You will find a minimal working example below. It is creating an
> animation where a diagonal line is sliding through the graph. And I
> wanted to have the legend set accordingly. I need the label as I have
> several axis environment to better show the evolution of values
> (different scales).
>
>
> \documentclass[11pt]{beamer}
> \usepackage[latin1]{inputenc}
> \usepackage{tikz}
> \usepackage{pgfplots}
> \usepackage{animate}
> \begin{document}
> \begin{frame}
> \frametitle{mwe}
> \begin{animateinline}[]{3}
> \multiframe{4}{iIdPic=1+1}{
> \begin{tikzpicture}[scale=0.6]
> \begin{axis}[ytick=\empty,xmin=0,xmax=5,hide x axis]
> \addplot+[mark=none] {3*x+\iIdPic};
> \label{Temp\iIdPic}
> \end{axis}
> \end{tikzpicture}
> }
> \end{animateinline}
> \end{frame}
> \end{document}
>
>
> Have I done something wrong?
>
> Thank you for your help,
> Cédric
>
|
|
From: Ihor R. <ro...@tu...> - 2014-03-19 17:10:17
|
Dear Christian,

Thank you very much for your very kind answer. After your correction
everything is OK with my plot until any kind of horizontal alignment of the
legend is used. Unfortunately, either "legend cell align=left" (used in the
example below) or "legend cell align=right" shifts letter 'e' out of the
circle in the legend. I have tried to control letter 'e' position using
'align=' key of the node in pgfdeclareplotmark without any success. Is it a
bug or (very advanced) feature?

\documentclass[tikz]{standalone}
\usepackage{pgfplots}
\pgfplotsset{compat=newest}

\pgfdeclareplotmark{e}
  {\filldraw[fill=white,draw=black] (0pt,0pt) circle [radius=3pt]
    node[text depth=0pt] {\scriptsize e};}

\begin{document}
\thispagestyle{empty}
\begin{tikzpicture}
\begin{axis}[legend cell align=left] %% alignment of the legend
 \addplot[mark=e] coordinates {(0,1) (1,0)};
    \addlegendentry{test}
\end{axis}
\end{tikzpicture}
\end{document}

With best wishes
,
=========
I
hor
|
|
From: Christian F. <cfe...@go...> - 2014-03-14 08:43:40
|
Hi Ihor,

the legend uses nodes by itsself, and it reconfigures these nodes.

The legend style is
     /pgfplots/every axis legend/.style={%
         cells={anchor=center},
         inner xsep=3pt,inner ysep=2pt,nodes={inner sep=2pt,text
depth=0.15em},
         anchor=north east,%
         shape=rectangle,%
         fill=white,%
         draw=black,
         at={(0.98,0.98)},
     },

In particular, the style "nodes" affects your nodes as well. You need to
reset the node-specific options to their default, for example

\pgfdeclareplotmark{e}
   {\filldraw[fill=white,draw=black] (0pt,0pt) circle [radius=3pt]
node[text depth=0pt] {\scriptsize e};}

Kind regards

Christian

Am 10.03.2014 10:40, schrieb Ihor Rokach:
> Hello,
>
> I am trying to define a custom mark using \pgfdeclareplotmark. In the
> example shown below letter e in the legend is a bit shifted with
> respect to the center of the circle. It is placed properly, however,
> in each mark in the plot itself. How could I fix it? I am using the
> latest versions of PGF and Pgfplots, MikTeX 2.9 on Windows XP 32.
>
> --------------------------------------------- start of the example ---
> \documentclass{article}
> \usepackage{pgfplots}
>
> \pgfplotsset{compat=newest}
>
> \pgfdeclareplotmark{e}
>   {\filldraw[fill=white,draw=black] (0pt,0pt) circle [radius=3pt] node
> {\scriptsize e};}
>
> \begin{document}
> \thispagestyle{empty}
> \begin{tikzpicture}
> \begin{axis}[]
> \addplot[mark=e] coordinates {(0,1) (1,0)};
>     \addlegendentry{test}
> \end{axis}
> \end{tikzpicture}
> \end{document}
>
> --------------------------------------------- end of the example ---
>
> With best wishes
> ,
> =========
> Ihor
>
>
> ------------------------------------------------------------------------------
> Learn Graph Databases - Download FREE O'Reilly Book
> "Graph Databases" is the definitive new guide to graph databases and their
> applications. Written by three acclaimed leaders in the field,
> this first edition is now available. Download your free book today!
> http://p.sf.net/sfu/13534_NeoTech
>
>
> _______________________________________________
> Pgfplots-features mailing list
> Pgf...@li...
> https://lists.sourceforge.net/lists/listinfo/pgfplots-features
|
|
From: Ihor R. <ro...@tu...> - 2014-03-10 09:40:58
|
Hello,

I am trying to define a custom mark using \pgfdeclareplotmark. In the
example shown below letter e in the legend is a bit shifted with respect to
the center of the circle. It is placed properly, however, in each mark in
the plot itself. How could I fix it? I am using the latest versions of PGF
and Pgfplots, MikTeX 2.9 on Windows XP 32.

--------------------------------------------- start of the example ---
\documentclass{article}
\usepackage{pgfplots}

\pgfplotsset{compat=newest}

\pgfdeclareplotmark{e}
  {\filldraw[fill=white,draw=black] (0pt,0pt) circle [radius=3pt] node
{\scriptsize e};}

\begin{document}
\thispagestyle{empty}
\begin{tikzpicture}
\begin{axis}[]
 \addplot[mark=e] coordinates {(0,1) (1,0)};
    \addlegendentry{test}
\end{axis}
\end{tikzpicture}
\end{document}

--------------------------------------------- end of the example ---

With best wishes
,
=========
Ihor
|
|
From: Christian F. <cfe...@go...> - 2014-03-04 08:20:11
|
Hello to all users of pgfplots, I am proud to announce the release of pgfplots 1.10 . It is available for download on http://sourceforge.net/projects/pgfplots/files/pgfplots/1.10/ and will become available on CTAN within the next 24 hours. MikTeX will mirror these files eventually. Pgfplots 1.10 comes with one major new feature: the ability to fill the area enclosed by two plots. Kind regards Christian HISTORY: 1.10: - new feature: fill between plots (library fillbetween) - new feature: concatenate intersection segments (library fillbetween) - fixed bug: xelatex failed to run contour external - fixed incompatibility with \label and \usepackage{mcaption} - fixed bug: histograms produced wrong point meta - fixed bug: histograms reported the wrong 'plot name' and confused shifts of bar plots 1.9: - new feature: asymmetric error bars - new feature: activated math parser for axis limit arguments, arguments in axis cs, and domain argument in log plots - new feature: stacked bar plots place their 'nodes near coords' correctly in the middle and print the increment (compat=1.9) - new feature: stacked bar plots suppress empty increments (compat=1.9). - new feature: 'scatter/position=relative|absolute' allow to position 'nodes near coords' absolutely. use-case: bar plots + nodes near coords which are at, say, y=0 rather than their y value - new feature: integration of smooth shadings & auto-CMYK conversion \usepackage[cmyk]{xcolor} or \selectcolormodel{cmyk} will reconfigure pgfplots to use CMYK (document-wide) - new feature (advanced audience only): programmatic access to data coordinates during the visualization phase -> allows much more customization for error bars, stacked plots, nodes near coords. - wrote beginner tutorials - fixed bug: error bars and point meta did not work together - fixed bug: stacked plots did not respect 'visualization depends on' - fixed bug: luatex 0.76 is not backwards compatible; added version switch - fixed bug: ternary library precision has been improved - fixed bug: problem with axis limits very close to 0 - fixed bug: colormap specification limit case produced out of bounds exception 1.8: - new feature: tight bounding box even if the axis is no box and bb excludes clip path - new feature: mesh/color input=explicit - new feature: shader=interp now has drivers for both dvipdfmx and xetex - new feature: support for more color spaces in colormap definitions - new feature: shader=interp and device-level gray colorspaces - new feature: 'contour/contour dir=[xyz]' to draw contours in different directions - new feature: statistics library with boxplot handler (both boxplot prepared and automatic computation) - fixed bug: 3d centered axis lines and label placement (requires compat=1.8 or higher) - fixed bug: axis lines and placement of labels, tick scale labels, and reversed axes (requires compat=1.8 or higher) - fixed bug: filtering out coords from a mesh plot failed - fixed bug: every legend image post was not respected inside of \ref{plotlabel} - fixed bug: high-order patches computed the shader=flat mean in a wrong way. - fixed bug: remember picture inside of pgfplots axes failed (due to cell picture) - fixed bug: now, the tick scale label will be omitted if there are no ticks - fixed bug: axis box path was not closed - fixed bug: the bounding box was non-empty even if the axis was hidden. - fixed bug: auto-alignment of nodes near coords failed for xbar plots - fixed bug: providing bar width / bar shift in terms of axis units did not work with [xy]bar and nodes near coords - fixed bug: transformation 'data cs=cart' -> polar is more robust now - fixed bug: code did not compile against pgf 2.00 - fixed bug: patch plot lib and shader=interp,patch type=biquadratic - fixed bug: context path searching issue (pgfplots.lua) - fixed bug: shader=interp and dvips driver - fixed bug: error bars with explicit relative input failed 1.7 - added feature: 'bar shift' and 'bar width' can now be expressed in terms of axis units (compat=1.7 or higher) - fixed incompatibility regression pgfplots 1.6.1 pgf 2.10: layers - fixed incompatibility pgfplots and imakeidx - added feature: 'enlargelimits={abs=1cm}', i.e. enlarge by dimension rather than unit - patchplots lib: added patch type=bicubic - patchplots lib: added support for global paths (fillable) - patchplots lib: added patch type sampling feature - patchplots lib: improved usability (documentation and improvements) - fixed path issues in context: moved lua input file to tex/generic - fixed bug: \ref{legendimage} inside of legend text was wrong. 1.6.1: - fixed incompatibility lualatex,shader=interp, and german package (introduced in 1.6) 1.6: - added support for layered graphics (main use case: multiple axes and layers) - added support for second colormap in mesh plots (mesh/interior colormap name) - added support for scopes inside of axes - contour plots: added ability to provide list of discrete labels (mesh/levels) - empty lines are interpreted as interruptions in data plots (was undocumented since 1.4) - added more scaling options to 'scale mode=scale uniformly' (affects axis equal in 3d and \addplot3 graphics) - fixed wrong implementation of 'axis equal' and 'unit vector ratio' in 3d (backwards compatible for 2d, but not for 3d - the 3d implementation was plain wrong) - fixed incompatibility of lualatex and shader=interp - fixed bugs/added features around \addplot3 graphics - fixed bug: colorbar did not support ymode=log - fixed a couple of minor bugs - fixed bounding box computation for clip=false,axis lines=none 1.5.1: - more operations for FPU library (==, !=,<=,>=,?) - fixed bug in usage of decorations in \addplot - bugfix for contour prepared format=matlab - added 'const plot mark mid' and 'jump mark mid' plot handlers - nodes on a plot (\addplot ... node[pos=<fraction>] {};) - 'trim axis group left' and 'trim axis group right' - bugfixes for polar axes and log+stacked plots - added style 'log ticks with fixed point' - introduced patched tikz paths to simplify circles and ellipses within an axis - patchplots lib: patch type=polygon - some more bugfixes 1.5: - Contour plots, - Histograms, - Quiver plots, - patch plots (library) - Triangle Meshes - Bilinear Elements - Quadratic Triangles - Biquadratic Quadrilaterals - Coons Patches - Discrete colorbars, - Table sorting, - Linear regression, - Ternary diagrams, - Tieline Plots - Smith Charts - Polar axes, - Empty lines in input files result in interrupted plots, - PDF user defined coordinate mouse popups - CMYK colormaps and shadings, - new markers and cycle lists - access to axis limits, - \addplot3 graphics: pgfplots draws an appropriate axis for a three-dimensional(!) external png graphics - 3D axes: support to provide explicit unit vectors: - explicit unit vectors - explicit unit vectors which are uniformly rescaled to match width/height - 3D axes: improved support for unit vector ratios - improvements of the groupplot styles - preliminary support for (2d) bar plots in 3d axes - new shader 'faceted interp' - table package: - 'every nth row' style - 'comment chars' key to define comment characters in input files - 'skip first n' style - lots of smaller bugfixes (see ChangeLog for details) 1.4.1: - improved compatibility to gnuplot 4.4 1.4: Version 1.4 contains several new features, mostly work on details. It fixes many bugs and provides the following improvements: - detached legends - detached colorbars - ybar (and similar plots) can now be mixed with other plot types like line plots. - improved legend formatting - added 'restrict x to domain*' which cups coordinates outside of a specified domain (same for y and z) - Added support for linear regression - Inline tables, - Lots of bug fixes The next version will make a greater step when it is stable. 1.3.1: Version 1.3.1 is a bugfix release containing - improved parametric plots with gnuplot - improved normalsize, small and footnotesize scale styles and added tiny - a lot of bugfixes 1.3: - improvements for two dimensional visualization, among them - axis equal, - color bars, - nodes near coords, - jumps in plots, - improved description positioning, - reverseable axis directions, - simpler alignment of adjacent axes, - units and a simplified user interface, - new three dimensional line, scatter, mesh and surface plots, - a copy of the automatic pdf externalization library, - an improved manual enhanced with a lot of pdf cross references. 1.2.2: - fixed a problem with the samples key, - provides some smaller fixes and some manual improvements. - added plot graphics. 1.2: - completely rewritten math expression parser with extended data range, - colormaps for scatter plots - fine tuning for plot parameters. - table package has been extended and is now a fully featured table typesetting, computing and postprocessing tool. |
|
From: Christian F. <cfe...@go...> - 2014-03-03 20:24:59
|
Hi Keving, sounds great. If you like, you can send us a reduced example! Regarding "smooth curves": I do not understand the requirement of "curves to loft between"... but I am sure you will find a solution. The color interpolation order is 1 (linear interpolation), that is correct. The only way to overcome this limitation would be to add more samples, i.e. to modify your triangulation add add more color values in the middle. Note that even the patchplots library has first order color interpolation, even if the geometry supports up to third order interpolation. Kind regards Christian Am 03.03.2014 18:29, schrieb Kevin Smith: > Thanks for your reply. I ended up using two poly lines to represent the curves and I output them with same number of vertices . I then used a standard surface and assigned a different color with explicit coloring method to the vertices on each curve so I get a nice gradient between the two. It looks great ! > Next enhancement is that i would like to draw smooth curves to loft between. Also I would like the coloring to blend into the color of one curve as the other curved gets closer. Right now it's just a linear interpolation it looks like. > > Sent from my iPhone > >> On Mar 3, 2014, at 8:56 AM, Christian Feuersaenger <cfe...@go...> wrote: >> >> Hi Kevin, >> >> The question's title hints in direction of "3d surface/patch plotting" and the question text of sorts "generate a surface between the two" also includes the keyword "surface". However, the task described in the associated paragraph could be stated as general question of sorts "I have two curves and would like to fill the enclosed area - how can I do this?". >> >> The reason why I am asking this question is: pgfplots 1.10 is about to be released (that means within the next days). And it will come with one major feature, namely the ability to fill the area enclosed by two arbitrary curves. However, this kind of filling is two--dimensional in its nature, and it would have constant color (or a pattern/shading which is independent of the curve data). This new "fillbetween" feature will probably work out of the box, its syntax will be "\addplot fill between[of=A and B];" where "A" and "B" are sort of labels for the two input curves. >> >> You may want browse through the pdf manual of the release candidate http://pgfplots.sourceforge.net/pgfplots_unstable.pdf (section "Libraries >> Fill Between"). >> >> *If* that is satisfies your needs, you can simply wait for a couple of days and download that new version (announcements will be sent to this list). >> >> If you really need a surface (probably with interpolated color data), then we would need to come back to your problem at hand. My first assessment would be that you'd need to triangulate the area manually and visualize the resulting triangles by means of a surf or patch plot. In other words: you have to come up with a suitable sequence of patches (perhaps triangles as the most simple ones) on your own; the visualization as mesh or surface would be done by pgfplots. A related solution could be http://tex.stackexchange.com/questions/91689/visualize-data-on-a-variable-radius-graph-network/93858#93858 . >> Clearly, this approach would benefit from a good set of sampling points for both input curves. The triangulation could be done in your external program which generates the points. >> >> If you need help on this second topic (perhaps about the expected input format), you can post another question here, optimally with a minimal working example. >> >> Kind regards >> >> Christian >> >> >> Am 28.02.2014 21:28, schrieb Kevin Smith: >>> Hello, >>> >>> I have started to experiment with pgfplots for plotting some 3-d data that I would like to visualize. >>> >>> What I would like to do seems like it should be simple, but perhaps I need a little bit of direction from the experts on which approach I should take. >>> >>> I have two 3D curves which are each represented by an array of (x,y,z) data. So far, I have learned enough to where I can plot the curves individually in a graph using addplot3 and I have been able to export my data so that it is in a nice text format for addplot3 coordinate syntax.. >>> >>> One view of this data would be simply to show the two curves in the graph but in different colors with their own label. That should be fairly simple. >>> >>> As an extension of this, I would wonder if it would be possible to generate a surface between the two curves so that the gaps or differences between the two curves could be better visualized. I have tried various patch example settings in the gallery but none of them seem to give what I want. Since the 2 curves are somewhat similar, the desired result would be that the surface would look like a "ribbon" between the curves, where the ribbon might vary in width, depending on the gap between the curves. >>> >>> Another issue is that the two curves can each have a different number of points. I could potentially interpolate the curves before I export them, so that the data for each curve will be of the same dimension if that makes it easier. >>> >>> Thanks in advance for any suggestions… >>> >>> >>> >>> >>> ------------------------------------------------------------------------------ >>> Flow-based real-time traffic analytics software. Cisco certified tool. >>> Monitor traffic, SLAs, QoS, Medianet, WAAS etc. with NetFlow Analyzer >>> Customize your own dashboards, set traffic alerts and generate reports. >>> Network behavioral analysis & security monitoring. All-in-one tool. >>> http://pubads.g.doubleclick.net/gampad/clk?id=126839071&iu=/4140/ostg.clktrk >>> >>> >>> _______________________________________________ >>> Pgfplots-features mailing list >>> Pgf...@li... >>> https://lists.sourceforge.net/lists/listinfo/pgfplots-features |
|
From: Kevin S. <k2m...@gm...> - 2014-03-03 17:29:49
|
Thanks for your reply. I ended up using two poly lines to represent the curves and I output them with same number of vertices . I then used a standard surface and assigned a different color with explicit coloring method to the vertices on each curve so I get a nice gradient between the two. It looks great ! Next enhancement is that i would like to draw smooth curves to loft between. Also I would like the coloring to blend into the color of one curve as the other curved gets closer. Right now it's just a linear interpolation it looks like. Sent from my iPhone > On Mar 3, 2014, at 8:56 AM, Christian Feuersaenger <cfe...@go...> wrote: > > Hi Kevin, > > The question's title hints in direction of "3d surface/patch plotting" and the question text of sorts "generate a surface between the two" also includes the keyword "surface". However, the task described in the associated paragraph could be stated as general question of sorts "I have two curves and would like to fill the enclosed area - how can I do this?". > > The reason why I am asking this question is: pgfplots 1.10 is about to be released (that means within the next days). And it will come with one major feature, namely the ability to fill the area enclosed by two arbitrary curves. However, this kind of filling is two--dimensional in its nature, and it would have constant color (or a pattern/shading which is independent of the curve data). This new "fillbetween" feature will probably work out of the box, its syntax will be "\addplot fill between[of=A and B];" where "A" and "B" are sort of labels for the two input curves. > > You may want browse through the pdf manual of the release candidate http://pgfplots.sourceforge.net/pgfplots_unstable.pdf (section "Libraries >> Fill Between"). > > *If* that is satisfies your needs, you can simply wait for a couple of days and download that new version (announcements will be sent to this list). > > If you really need a surface (probably with interpolated color data), then we would need to come back to your problem at hand. My first assessment would be that you'd need to triangulate the area manually and visualize the resulting triangles by means of a surf or patch plot. In other words: you have to come up with a suitable sequence of patches (perhaps triangles as the most simple ones) on your own; the visualization as mesh or surface would be done by pgfplots. A related solution could be http://tex.stackexchange.com/questions/91689/visualize-data-on-a-variable-radius-graph-network/93858#93858 . > Clearly, this approach would benefit from a good set of sampling points for both input curves. The triangulation could be done in your external program which generates the points. > > If you need help on this second topic (perhaps about the expected input format), you can post another question here, optimally with a minimal working example. > > Kind regards > > Christian > > > Am 28.02.2014 21:28, schrieb Kevin Smith: >> Hello, >> >> I have started to experiment with pgfplots for plotting some 3-d data that I would like to visualize. >> >> What I would like to do seems like it should be simple, but perhaps I need a little bit of direction from the experts on which approach I should take. >> >> I have two 3D curves which are each represented by an array of (x,y,z) data. So far, I have learned enough to where I can plot the curves individually in a graph using addplot3 and I have been able to export my data so that it is in a nice text format for addplot3 coordinate syntax.. >> >> One view of this data would be simply to show the two curves in the graph but in different colors with their own label. That should be fairly simple. >> >> As an extension of this, I would wonder if it would be possible to generate a surface between the two curves so that the gaps or differences between the two curves could be better visualized. I have tried various patch example settings in the gallery but none of them seem to give what I want. Since the 2 curves are somewhat similar, the desired result would be that the surface would look like a "ribbon" between the curves, where the ribbon might vary in width, depending on the gap between the curves. >> >> Another issue is that the two curves can each have a different number of points. I could potentially interpolate the curves before I export them, so that the data for each curve will be of the same dimension if that makes it easier. >> >> Thanks in advance for any suggestions… >> >> >> >> >> ------------------------------------------------------------------------------ >> Flow-based real-time traffic analytics software. Cisco certified tool. >> Monitor traffic, SLAs, QoS, Medianet, WAAS etc. with NetFlow Analyzer >> Customize your own dashboards, set traffic alerts and generate reports. >> Network behavioral analysis & security monitoring. All-in-one tool. >> http://pubads.g.doubleclick.net/gampad/clk?id=126839071&iu=/4140/ostg.clktrk >> >> >> _______________________________________________ >> Pgfplots-features mailing list >> Pgf...@li... >> https://lists.sourceforge.net/lists/listinfo/pgfplots-features > |
|
From: Christian F. <cfe...@go...> - 2014-03-03 16:56:19
|
Hi Kevin, The question's title hints in direction of "3d surface/patch plotting" and the question text of sorts "generate a surface between the two" also includes the keyword "surface". However, the task described in the associated paragraph could be stated as general question of sorts "I have two curves and would like to fill the enclosed area - how can I do this?". The reason why I am asking this question is: pgfplots 1.10 is about to be released (that means within the next days). And it will come with one major feature, namely the ability to fill the area enclosed by two arbitrary curves. However, this kind of filling is two--dimensional in its nature, and it would have constant color (or a pattern/shading which is independent of the curve data). This new "fillbetween" feature will probably work out of the box, its syntax will be "\addplot fill between[of=A and B];" where "A" and "B" are sort of labels for the two input curves. You may want browse through the pdf manual of the release candidate http://pgfplots.sourceforge.net/pgfplots_unstable.pdf (section "Libraries >> Fill Between"). *If* that is satisfies your needs, you can simply wait for a couple of days and download that new version (announcements will be sent to this list). If you really need a surface (probably with interpolated color data), then we would need to come back to your problem at hand. My first assessment would be that you'd need to triangulate the area manually and visualize the resulting triangles by means of a surf or patch plot. In other words: you have to come up with a suitable sequence of patches (perhaps triangles as the most simple ones) on your own; the visualization as mesh or surface would be done by pgfplots. A related solution could be http://tex.stackexchange.com/questions/91689/visualize-data-on-a-variable-radius-graph-network/93858#93858 . Clearly, this approach would benefit from a good set of sampling points for both input curves. The triangulation could be done in your external program which generates the points. If you need help on this second topic (perhaps about the expected input format), you can post another question here, optimally with a minimal working example. Kind regards Christian Am 28.02.2014 21:28, schrieb Kevin Smith: > Hello, > > I have started to experiment with pgfplots for plotting some 3-d data > that I would like to visualize. > > What I would like to do seems like it should be simple, but perhaps I > need a little bit of direction from the experts on which approach I > should take. > > I have two 3D curves which are each represented by an array of (x,y,z) > data. So far, I have learned enough to where I can plot the curves > individually in a graph using addplot3 and I have been able to export > my data so that it is in a nice text format for addplot3 coordinate > syntax.. > > One view of this data would be simply to show the two curves in the > graph but in different colors with their own label. That should be > fairly simple. > > As an extension of this, I would wonder if it would be possible to > generate a surface between the two curves so that the gaps or > differences between the two curves could be better visualized. I have > tried various patch example settings in the gallery but none of them > seem to give what I want. Since the 2 curves are somewhat similar, the > desired result would be that the surface would look like a "ribbon" > between the curves, where the ribbon might vary in width, depending on > the gap between the curves. > > Another issue is that the two curves can each have a different number > of points. I could potentially interpolate the curves before I export > them, so that the data for each curve will be of the same dimension if > that makes it easier. > > Thanks in advance for any suggestions… > > > > > ------------------------------------------------------------------------------ > Flow-based real-time traffic analytics software. Cisco certified tool. > Monitor traffic, SLAs, QoS, Medianet, WAAS etc. with NetFlow Analyzer > Customize your own dashboards, set traffic alerts and generate reports. > Network behavioral analysis & security monitoring. All-in-one tool. > http://pubads.g.doubleclick.net/gampad/clk?id=126839071&iu=/4140/ostg.clktrk > > > _______________________________________________ > Pgfplots-features mailing list > Pgf...@li... > https://lists.sourceforge.net/lists/listinfo/pgfplots-features |
|
From: Kevin S. <k2m...@gm...> - 2014-02-28 20:28:56
|
Hello, I have started to experiment with pgfplots for plotting some 3-d data that I would like to visualize. What I would like to do seems like it should be simple, but perhaps I need a little bit of direction from the experts on which approach I should take. I have two 3D curves which are each represented by an array of (x,y,z) data. So far, I have learned enough to where I can plot the curves individually in a graph using addplot3 and I have been able to export my data so that it is in a nice text format for addplot3 coordinate syntax.. One view of this data would be simply to show the two curves in the graph but in different colors with their own label. That should be fairly simple. As an extension of this, I would wonder if it would be possible to generate a surface between the two curves so that the gaps or differences between the two curves could be better visualized. I have tried various patch example settings in the gallery but none of them seem to give what I want. Since the 2 curves are somewhat similar, the desired result would be that the surface would look like a "ribbon" between the curves, where the ribbon might vary in width, depending on the gap between the curves. Another issue is that the two curves can each have a different number of points. I could potentially interpolate the curves before I export them, so that the data for each curve will be of the same dimension if that makes it easier. Thanks in advance for any suggestions... |
|
From: Joshua K. <jos...@gm...> - 2014-01-23 20:40:46
|
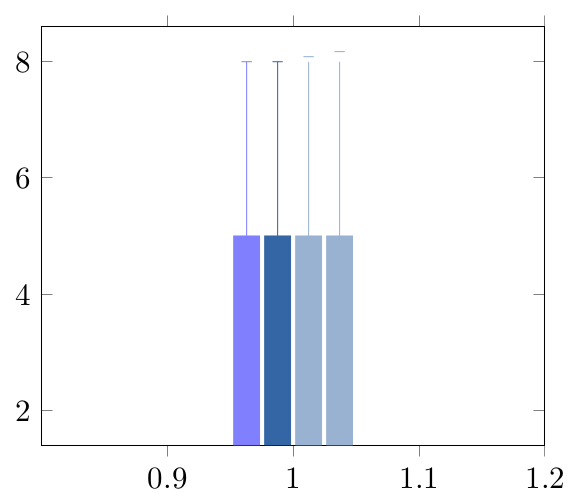
Dear list,

I'm using pgfplots to create some bar charts with error bars in ConTeXt,
and I want to use custom colours for them.  This works, but if I mix a
custom colour with another colour, it results in a gap between the
error bar line and the error bar mark.  If two custom colours are
mixed, the gap seems to be doubled.  Mixing with predefined colours
works normally.  MWE:

\usemodule[tikz]
\usemodule[pgfplots]

\definecolor	[Blue]	[h=3465a4]
\definecolor	[White]	[h=ffffff]

\pgfplotsset{compat=newest}

\starttext
\starttikzpicture
	\startaxis[ybar, error bars/y dir=both, error bars/y explicit]
		\addplot+[blue!50!white] coordinates {(1,5) +- (0,3)};
		\addplot+[Blue] coordinates {(1,5) +- (0,3)};
		\addplot+[Blue!50!white] coordinates {(1,5) +- (0,3)};
		\addplot+[Blue!50!White] coordinates {(1,5) +- (0,3)};
	\stopaxis
\stoptikzpicture
\stoptext

Here you can see the result:
http://666kb.com/i/cl86t0mfpin35tht7.png

Kind regards,
Joshua Krämer
|
|
From: Christian F. <cfe...@go...> - 2014-01-19 18:21:26
|
Hi Roland, thanks for your request. What you can to is to load your table and to transpose it afterwards. The manual for pgfplotstable explains how to manipulate tables. Attached is a minimal example which illustrates how to use it which will hopefully address your issue. Kind regards Christian Am 18.01.2014 16:27, schrieb Roland Rehmet: > Hello Christian, > > first I would like to say WOW to your package! > > I copied some data from an Excel spreadsheet to a table. All data are > in one line: > > 36465 38288 40203 42213 44324 46540 48867 51310 > 53876 56569 59398 62368 65486 > > Now I would like to print the data as y with x expr=\coordindex. > > So I figured out so far that it could be done with > > table [header=false,x expr=\coordindex,y index=0,row sep=space] > > Since row sep=space does not work (and may be useful?!?) I do not have > an idea to get it done. Well, I could press enter behind every number, > but that would stop my attempt to get it done automatically. > > What can I do instead? (And I worked through your huge manual.) > > Thank you! > > Kind regards > Roland > |
|
From: Liam H. <ln...@he...> - 2014-01-13 18:17:35
|
I'm having trouble figuring out how to move the tick labels on the radial axis of a polar plot. Any suggestions on how to do this? http://tex.stackexchange.com/questions/152734/polar-pgfplots-radial-axis-tick-labels Thanks, Liam |
|
From: Christian F. <cfe...@go...> - 2013-12-15 18:54:12
|
Hi Dirk,

[adding the list in CC as there might be others with the same problem. I
also stripped your screenshots because I do not know if they were
confidential]

yes, there is a possibility to generate colorbars in color space "gray"
by default. Interestingly, it is much more involved than I would like it
to be (I added a todo note to improve things).

The following example would do the job:

%\pdfcompresslevel=0
\documentclass{standalone}

% This tells 'xcolor' to define every color in 'gray'.
\usepackage[gray]{xcolor}
\usepackage{pgfplots}

\pgfplotsset{
compat=1.9,
% tells pgfplots to use 'gray' for any *newly generated* colormap:
colormap default colorspace=gray,
%
% workaround for a weakness of PGF: PGF does not support non-RGB
% shadings. But shader=interp does. And: the outcome is visually the same.
% -> use shader=interp:
colorbar sampled={surf,shader=interp},
%
% 'colorbar sampled' reconfigures styles and sets colorbar=true.
% Set it back:
colorbar=false,
%
% install and define the default color map.
colormap/blackwhite,
}


\begin{document}

\begin{tikzpicture}
\begin{axis}[
colorbar,
]
\addplot[mesh] {x};
\end{axis}
\end{tikzpicture}
\end{document}


The instruction \pdfcompresslevel=0 (combined with pdflatex) allows to
inspect the resulting pdf; the shading *did* use devicegray.

It seems, as if the combination of xcolor + pgfplots does not pick up
\usepackage[gray]{xcolor} as it ought to do (it works for CMYK,
interestingly). I will look into it why it failed.

Anyway; the preamble declarations above are part of the pgfplots stable
API and should work for you. I added inline comments which will
(hopefully) motivate their use; the manual contains references to each key.

Kind regards

Christian

PS
You may also want to declare

/pgfplots/mesh/colorspace explicit color output=gray

but this applies only to surface plots with explicit color.


Am 13.12.2013 18:08, schrieb Möller Dirk:
>
> Guten Tag Herr Feuersänger,
>
> pgfplot hat mir bereits super Dienste erwiesen, vielen Dank dafür.
>
> Sie schreiben, das der colorspace=gray einem rgb colorspace
> entspricht. Gibt es die Möglichkeit einen grayscale colorspace zu
> benutzten?
>
> Der Hintergrund ist der, dass mir ein „blackwhite colorbar“ ein
> „Farbbild“ gibt das nur aus graustufen besteht (oberes Bild). Diese
> werden wiederum unterschiedlich von Druckertreibern interpretiert. Im
> Unterschied dazu ist das untere Bild ein „echtes“ Graustufenbild
> (beide Plots enthalten ein Graustufenbild und sind daher bis auf den
> colorbar schwarz-weiss Plots).
>
> Mit freundlichen Grüssen,
>
> Dirk
>
>
>
> -------------------------------------------------------
>
> ETH Zurich
> Dirk Möller
>
> IMES / Center of Mechanics
>
> CLA H31
> Tannenstrasse 3
>
> 8092 Zurich
> SWITZERLAND
>
> dir...@im... <mailto:dir...@im...>
> www.zfm.ethz.ch/e/micromanipulation
> <http://www.zfm.ethz.ch/e/micromanipulation>
>
> +41 44 632 61 06 phone
>
> +41 44 632 11 45 fax
>
|
|
From: Lars K. J. <lar...@ho...> - 2013-12-10 18:36:19
|
Hi again, the previously mentioned question (http://tex.stackexchange.com/questions/141771/crop-ternary-plot) have now been answered and the last figure in the answer nicely displays the output I am looking for. A feature producing that output would be very convenient. Best regards Lars Klemet Jakobsson From: lar...@ho... To: pgf...@li... Subject: Crop ternary plots Date: Sat, 2 Nov 2013 12:04:16 +0100 Hi, it would be nice if it was possible to chop corners off ternary plots to exclude regions that are not relevant for a plot. This has also been posted as a question here: http://tex.stackexchange.com/questions/141771/crop-ternary-plot Best regards Lars Klemet Jakobsson |
|
From: Denis B. <dbi...@wa...> - 2013-10-27 08:18:55
|
Le dimanche 27/10/13 à 08h27,
Christian Feuersaenger <cfe...@go...> a écrit :

> Hi Denis,

Hi Christian,

> thanks for the feature request.

You're welcome: thanks to you for your answer! :)

> So what you like to do would be
>
> \pgfmathprintnumber{1,5}  and get 1,50 or something like that, right?

That's probably what I requested implies...

> Unfortunately, since the number parser is closely tight to the
> expression parser as well, you would also have the effect
>
> \pgfmathparse{ 1,5 + 0,5 }
>
> and would expect 2.0 as result.

Indeed.

> I fear this, in turn, has a couple of risks... I am unsure of wether
> that would be a good idea.

Well, I must admit this kind of side effects didn't come to my mind.

> Well, maybe I can add an option like that.

Could be nice.

> But it would probably cause defects when it is combined with
> expression parsing.

I could proceed to some tests if you specify to me what are the contexts
where these defects could arise.

Kind regards.
--
Denis
|
|
From: Christian F. <cfe...@go...> - 2013-10-27 07:27:20
|
Hi Denis,

thanks for the feature request.

So what you like to do would be

\pgfmathprintnumber{1,5}  and get 1,50 or something like that, right?


Unfortunately, since the number parser is closely tight to the
expression parser as well, you would also have the effect

\pgfmathparse{ 1,5 + 0,5 }

and would expect 2.0 as result. I fear this, in turn, has a couple of
risks... I am unsure of wether that would be a good idea.

Well, maybe I can add an option like that. But it would probably cause
defects when it is combined with expression parsing.

Kind regards

Christian

Am 23.10.2013 13:52, schrieb Denis Bitouzé:
> Hi,
>
> it could be nice for pgfplots to provide a way to specify the input
> decimal separator.
>
> Indeed, in France and probably more generally in Europe, the decimal
> separator is a comma, not a dot. Because of this, localized spreadsheets
> display values with commas as decimal separator that are stored when
> data is copied and pasted. Hence if a French user copies and pastes data
> from the spreadsheets to plain text file in order to plot it with
> pgfplots, he has first to search and replace all the commas by dots,
> which is a pain.
>
> BTW, I wanted to post this feature request on the dedicated SF site:
>
>    https://sourceforge.net/p/pgfplots/feature-requests/
>
> but there's no "Create Ticket" buttons.
>
> Best regards.
> --
> Denis
>
> ------------------------------------------------------------------------------
> October Webinars: Code for Performance
> Free Intel webinars can help you accelerate application performance.
> Explore tips for MPI, OpenMP, advanced profiling, and more. Get the most from
> the latest Intel processors and coprocessors. See abstracts and register >
> http://pubads.g.doubleclick.net/gampad/clk?id=60135991&iu=/4140/ostg.clktrk
> _______________________________________________
> Pgfplots-features mailing list
> Pgf...@li...
> https://lists.sourceforge.net/lists/listinfo/pgfplots-features
|
|
From: Denis B. <dbi...@wa...> - 2013-10-23 11:52:58
|
Hi, it could be nice for pgfplots to provide a way to specify the input decimal separator. Indeed, in France and probably more generally in Europe, the decimal separator is a comma, not a dot. Because of this, localized spreadsheets display values with commas as decimal separator that are stored when data is copied and pasted. Hence if a French user copies and pastes data from the spreadsheets to plain text file in order to plot it with pgfplots, he has first to search and replace all the commas by dots, which is a pain. BTW, I wanted to post this feature request on the dedicated SF site: https://sourceforge.net/p/pgfplots/feature-requests/ but there's no "Create Ticket" buttons. Best regards. -- Denis |
|
From: Christian F. <cfe...@go...> - 2013-10-05 10:59:59
|
Hello interested readers,

I am proud to announce the release of pgfplots 1.9 .

It has been submitted to CTAN and sourceforge and will be available for
download and upgrade in all TeX package managers within the next days.

See below for the changes introduced in 1.9.

Kind regards

Christian

HISTORY:
1.9:
- new feature: asymmetric error bars
- new feature: activated math parser for axis limit arguments, arguments
in axis cs, and domain argument in log plots
- new feature: stacked bar plots place their 'nodes near coords'
correctly in the middle and print the increment (compat=1.9)
- new feature: stacked bar plots suppress empty increments (compat=1.9).
- new feature: 'scatter/position=relative|absolute' allow to position
'nodes near coords' absolutely.
    use-case: bar plots + nodes near coords which are at, say, y=0
rather than their y value
- new feature: integration of smooth shadings & auto-CMYK conversion
     \usepackage[cmyk]{xcolor} or \selectcolormodel{cmyk} will
reconfigure pgfplots to use CMYK (document-wide)
- new feature (advanced audience only): programmatic access to data
coordinates during the visualization phase
     -> allows much more customization for error bars, stacked plots,
nodes near coords.
- wrote beginner tutorials
- fixed bug: error bars and point meta did not work together
- fixed bug: stacked plots did not respect 'visualization depends on'
- fixed bug: luatex 0.76 is not backwards compatible; added version switch
- fixed bug: ternary library precision has been improved
- fixed bug: problem with axis limits very close to 0
- fixed bug: colormap specification limit case produced out of bounds
exception


1.8:
- new feature: tight bounding box even if the axis is no box and bb
excludes clip path
- new feature: mesh/color input=explicit
- new feature: shader=interp now has drivers for both dvipdfmx and xetex
- new feature: support for more color spaces in colormap definitions
- new feature: shader=interp and device-level gray colorspaces
- new feature: 'contour/contour dir=[xyz]' to draw contours in different
directions
- new feature: statistics library with boxplot handler (both boxplot
prepared and automatic computation)
- fixed bug: 3d centered axis lines and label placement (requires
compat=1.8 or higher)
- fixed bug: axis lines and placement of labels, tick scale labels, and
reversed axes
     (requires compat=1.8 or higher)
- fixed bug: filtering out coords from a mesh plot failed
- fixed bug: every legend image post was not respected inside of
\ref{plotlabel}
- fixed bug: high-order patches computed the shader=flat mean in a wrong
way.
- fixed bug: remember picture inside of pgfplots axes failed (due to
cell picture)
- fixed bug: now, the tick scale label will be omitted if there are no ticks
- fixed bug: axis box path was not closed
- fixed bug: the bounding box was non-empty even if the axis was hidden.
- fixed bug: auto-alignment of nodes near coords failed for xbar plots
- fixed bug: providing bar width / bar shift in terms of axis units did
     not work with [xy]bar and nodes near coords
- fixed bug: transformation 'data cs=cart' -> polar is more robust now
- fixed bug: code did not compile against pgf 2.00
- fixed bug: patch plot lib and shader=interp,patch type=biquadratic
- fixed bug: context path searching issue (pgfplots.lua)
- fixed bug: shader=interp and dvips driver
- fixed bug: error bars with explicit relative input failed

1.7
- added feature: 'bar shift' and 'bar width' can now be expressed in
terms of axis units (compat=1.7 or higher)
- fixed incompatibility regression pgfplots 1.6.1 pgf 2.10: layers
- fixed incompatibility pgfplots and imakeidx
- added feature: 'enlargelimits={abs=1cm}', i.e. enlarge by dimension
rather than unit
- patchplots lib: added patch type=bicubic
- patchplots lib: added support for global paths (fillable)
- patchplots lib: added patch type sampling feature
- patchplots lib: improved usability (documentation and improvements)
- fixed path issues in context: moved lua input file to tex/generic
- fixed bug: \ref{legendimage} inside of legend text was wrong.

1.6.1:
- fixed incompatibility lualatex,shader=interp, and german package
(introduced in 1.6)

1.6:
- added support for layered graphics (main use case: multiple axes and
layers)
- added support for second colormap in mesh plots (mesh/interior
colormap name)
- added support for scopes inside of axes
- contour plots: added ability to provide list of discrete labels
(mesh/levels)
- empty lines are interpreted as interruptions in data plots (was
undocumented since 1.4)
- added more scaling options to 'scale mode=scale uniformly' (affects
axis equal in 3d
   and \addplot3 graphics)
- fixed wrong implementation of 'axis equal' and 'unit vector ratio' in 3d
   (backwards compatible for 2d, but not for 3d - the 3d implementation
was plain wrong)
- fixed incompatibility of lualatex and shader=interp
- fixed bugs/added features around \addplot3 graphics
- fixed bug: colorbar did not support ymode=log
- fixed a couple of minor bugs
- fixed bounding box computation for clip=false,axis lines=none

1.5.1:
- more operations for FPU library (==, !=,<=,>=,?)
- fixed bug in usage of decorations in \addplot
- bugfix for contour prepared format=matlab
- added 'const plot mark mid' and 'jump mark mid' plot handlers
- nodes on a plot (\addplot ... node[pos=<fraction>] {};)
- 'trim axis group left' and 'trim axis group right'
- bugfixes for polar axes and log+stacked plots
- added style 'log ticks with fixed point'
- introduced patched tikz paths to simplify circles and ellipses within
an axis
- patchplots lib: patch type=polygon
- some more bugfixes

1.5:
  - Contour plots,
  - Histograms,
  - Quiver plots,
  - patch plots (library)
       - Triangle Meshes
       - Bilinear Elements
       - Quadratic Triangles
       - Biquadratic Quadrilaterals
       - Coons Patches
  - Discrete colorbars,
  - Table sorting,
  - Linear regression,
  - Ternary diagrams,
       - Tieline Plots
  - Smith Charts
  - Polar axes,
  - Empty lines in input files result in interrupted plots,
  - PDF user defined coordinate mouse popups
  - CMYK colormaps and shadings,
  - new markers and cycle lists
  - access to axis limits,
  - \addplot3 graphics: pgfplots draws an appropriate axis for a
three-dimensional(!) external png graphics
  - 3D axes: support to provide explicit unit vectors:
      - explicit unit vectors
     - explicit unit vectors which are uniformly rescaled to match
width/height
  - 3D axes: improved support for unit vector ratios
  - improvements of the groupplot styles
  - preliminary support for (2d) bar plots in 3d axes
  - new shader 'faceted interp'
  - table package:
      - 'every nth row' style
     - 'comment chars' key to define comment characters in input files
     - 'skip first n' style
  - lots of smaller bugfixes (see ChangeLog for details)
|
|
From: aurelien c. <aco...@gm...> - 2013-09-10 08:31:54
|
Hi, I'm trying to make a polar plot with shaded area between two plots. Is that possible? I have tried with stacked=y and closedcycle, but to no avail. Thanks! -- Aurélien Coillet |
|
From: Neal H. W. <ne...@wa...> - 2013-08-06 10:37:33
|
Hi, At Tue, 06 Aug 2013 09:38:59 +0200, idh...@ma... wrote: > I've been using pgfplot to make my graphs from files in regular Latex > documents (Article, Beamer, ...) and so far they worked just fine. > However when I try to use them in a poster done with tikzposter the > labeling and positioning is completly wrong and some of the curves of > the graph are on wrong places. Does anyone have an idea of how to make > pgfplot work correctly with tikzposter? You might get more help if you provide a minimal example demonstrating the problem. Neal |
|
From: <idh...@ma...> - 2013-08-06 07:39:17
|
Hi all, I've been using pgfplot to make my graphs from files in regular Latex documents (Article, Beamer, ...) and so far they worked just fine. However when I try to use them in a poster done with tikzposter the labeling and positioning is completly wrong and some of the curves of the graph are on wrong places. Does anyone have an idea of how to make pgfplot work correctly with tikzposter? Regards Iván |
|
From: Neal H. W. <ne...@wa...> - 2013-07-04 08:25:15
|
At Wed, 3 Jul 2013 15:38:52 -0500, Kasra Fattah wrote: > I'm using \tikzexternalize option of pgfplots and I have \addplot gnuplot > in my code which generates a table and I use the table command for showing > the errorbars of the plot, however, I explicitly provide the name of the > table file created by gnuplot. But with \tikzexternalize the figure# is > also appended to the name of the generated table file so how can I input > that into the name of the table file I provide? because if the figure > number is changed I have to go and manually change that name but there > should be a way that pgfplots take care of it, is there any trick to that? > > the table file name is : jobname.pgf-plots.figure1.table > > How can I replace figure1 part which can adapt itself if I add a figure > before that and it becomes figure2? right now I have to go into the code > and change it to figure2 manually. \tikzsetfigurename might help. Neal |