Menu
▾
▴

Home
MorphoLim: Identifying city boundaries
MorphoLim is dedicated to the identification of the morphological boundary of urban agglomerations. The method used avoids the need for any pre-defined maximum distance threshold between buildings. It is based on the conceptual and methodological tools of fractal geometry.
Authors of the application: Cécile Tannier, Gilles Vuidel, and Pierre Frankhauser (ThéMA, Besançon, France)
Conception date: 2009
Step 1: Step-by-step dilation and counting of the number of built clusters
The data used are vector maps representing buildings in 2D (polygons). The spatial extent of a study area is necessarily large because it comprises an (either monopolar or multipolar) urban agglomeration and its hinterland (i.e., a suburban or rural area that is under the influence of its urban core).
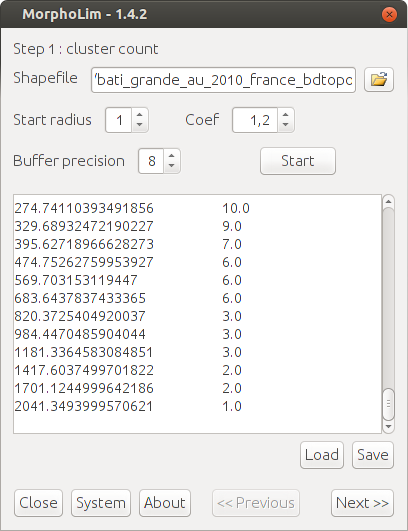
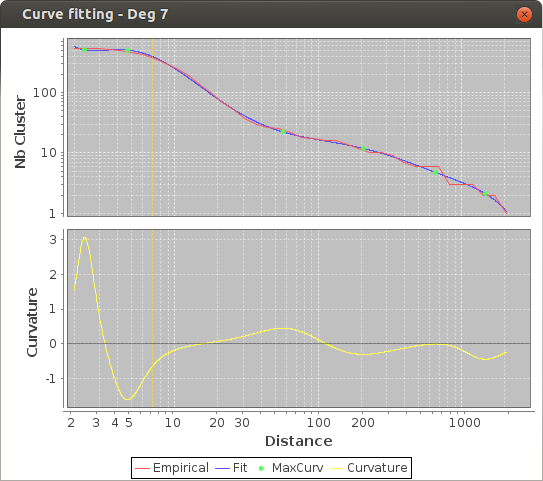
A vector version of the Minkowski dilation is applied to each built polygon of a map. This consists in surrounding each built polygon with a buffer of increasing width. The width of the buffer increases according to a geometric logic, which corresponds to the fractal logic. The number of clusters is counted after each dilation step. The results are portrayed as a log-log plot, where the X-axis represents the width of the dilation buffer and the Y-axis represents the corresponding number of built clusters.
Step 2: Identification of a significant threshold on the dilation curve
A distance threshold is located on the dilation curve corresponding to a major change in its behavior. We therefore measure the maximum curvature of the dilation curve.
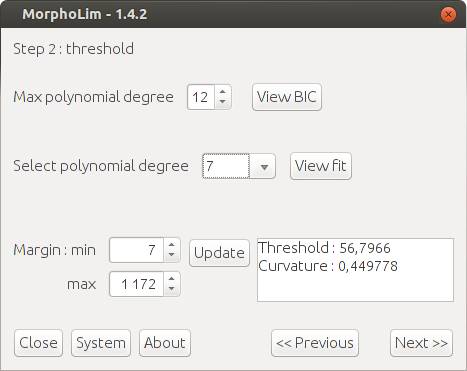
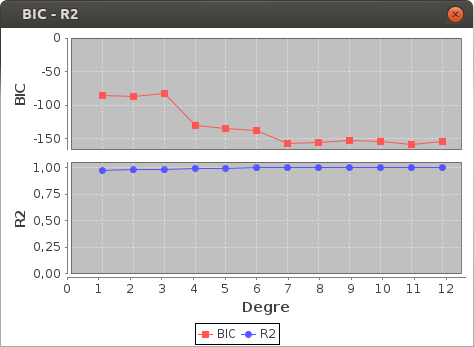
To identify the point of main curvature, the dilation curve is approximated by a series of polynomials of increasing degrees. We then select the polynomial of the lowest degree that best represents the original curve. This choice is based on Schwartz’s Bayesian Information Criterion (BIC).
Once the estimated curve is obtained, points of maximum curvature are identified: they are characterized by a zero derivation value of the curvature function. The point of main curvature has the highest absolute value of curvature among the points of maximum curvature. Finally, the point of main curvature is located on the estimated curve, which gives the distance threshold for drawing an urban envelope.
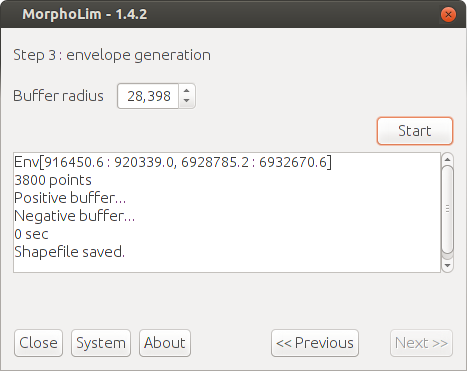
Step 3: Compute the urban envelope
References
Tannier C., Thomas I., Vuidel G., Frankhauser P. (2011). A Fractal Approach to Identifying Urban Boundaries, Geographical Analysis 43(2), pp 211-227.