Menu
▾
▴
[Matplotlib-users] map projections
|
From: Jeff W. <js...@fa...> - 2004-07-13 12:00:28
|
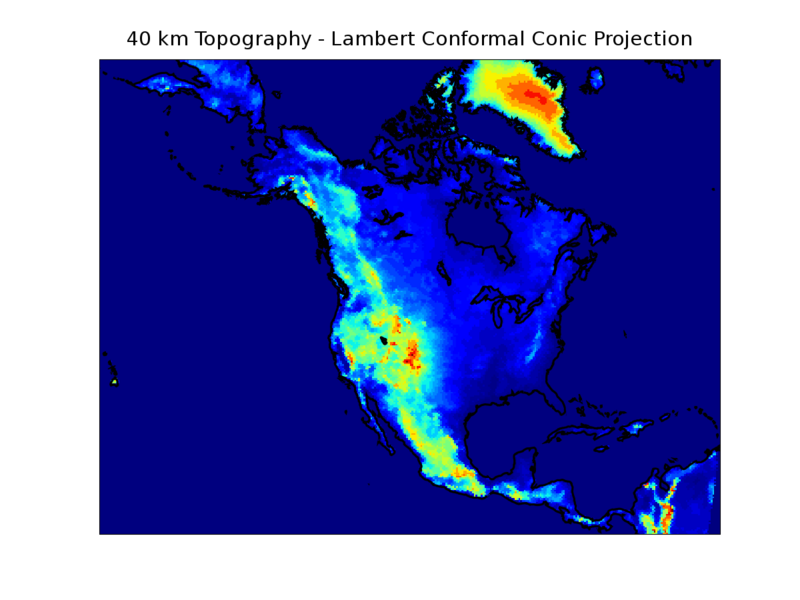
Hi: I've hacked together some scripts that let me plot data on top of world maps with different map projections in matplotlib. It's quite slow, but it works! There's an example at http://www.cdc.noaa.gov/people/jeffrey.s.whitaker/plotmap.py (the plot should look like http://www.cdc.noaa.gov/people/jeffrey.s.whitaker/plotmap.png). To run the example you'll need the data files http://www.cdc.noaa.gov/people/jeffrey.s.whitaker/wcl.txt (world coastlines) and http://www.cdc.noaa.gov/people/jeffrey.s.whitaker/topodata.pickle (data to plot), as well as a module I wrote to compute cartographic transformations using proj4 http://www.cdc.noaa.gov/people/jeffrey.s.whitaker/python/proj.py. If anyone knows of a faster way to do this, I'd love to hear about it. -Jeff -- Jeffrey S. Whitaker Phone : (303)497-6313 NOAA/OAR/CDC R/CDC1 FAX : (303)497-6449 325 Broadway Web : http://www.cdc.noaa.gov/~jsw Boulder, CO, USA 80305-3328 Office: Skaggs Research Cntr 1D-124 |
.)