Menu
▾
▴
Re: [Matplotlib-users] 3D surface plot with box frame
|
From: Benjamin R. <ben...@ou...> - 2014-06-27 01:27:20
|
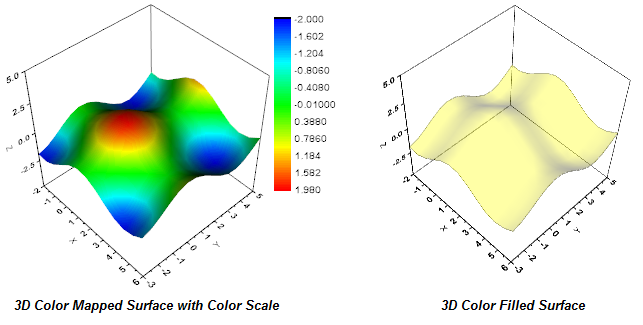
If you supply the code you did to get where you got, I have a rough idea how to get what you need. Essentially, you need to set the edgecolor of the panes, I think. I have to dig a bit in the code to see how to do that, though. Cheers! Ben Root On Thu, Jun 26, 2014 at 7:42 PM, Dawes, Andrew M. <da...@pa...> wrote: > I’m trying to plot a 3d surface with a box frame around both sides (see > example in the following link) > > comparable example: > http://cloud.originlab.com/www/products/images2/3DGraph_ColorSurface.png > > I made the axis panes white and disabled the grid which gets me 80% of > the way. I don’t see anything obvious for showing additional axis lines to > make the rest of the box (if such an option exists). > > Any suggestions/hacks are welcome! > > Thanks, Andy > > > -- > Andrew M.C. Dawes > Associate Professor of Physics > Pacific University > amcdawes.com > > > ------------------------------------------------------------------------------ > Open source business process management suite built on Java and Eclipse > Turn processes into business applications with Bonita BPM Community Edition > Quickly connect people, data, and systems into organized workflows > Winner of BOSSIE, CODIE, OW2 and Gartner awards > http://p.sf.net/sfu/Bonitasoft > _______________________________________________ > Matplotlib-users mailing list > Mat...@li... > https://lists.sourceforge.net/lists/listinfo/matplotlib-users > > |
