Menu
▾
▴
[Matplotlib-users] how to draw concentric donuts chart ?
|
From: 不坏阿峰 <onl...@gm...> - 2014-05-16 11:51:27
|
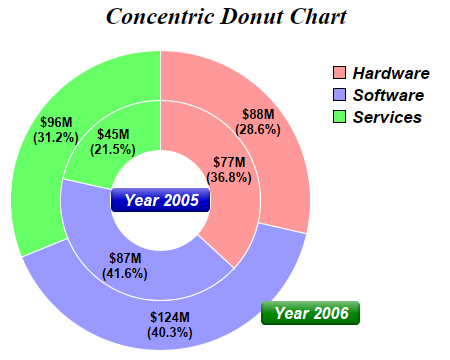
Dear all how to use matplotlib to drew chart like this ? http://www.advsofteng.com/doc/cdpydoc/images/concentric.png |
