Menu
▾
▴
matplotlib-users
|
From: sweep <rem...@gm...> - 2014-03-15 18:06:33
|
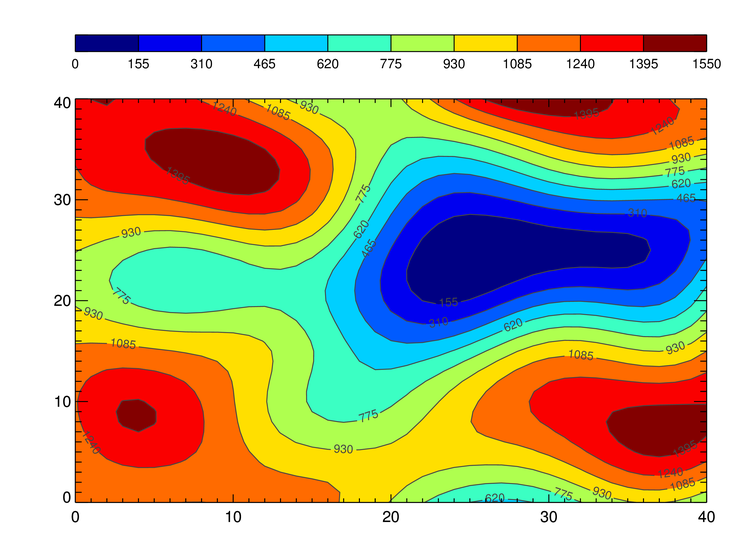
Hi, im trying to create a heatmap/colourmap/contour style plot similar to http://www.idlcoyote.com/cg_tips/outcontourbar.png but I cant seem to get it working correctly. The code takes a number of parameters on the command line because it is passed by an external PHP script. Essentially its a list of lat/lon/values which I want to interpolate and plot but I cant get anything like the image above, I cant get the vmin/vmax to work for the colorbar and I dont know why the whole plot is squared off rather than fading to white if you see what I mean import os import tempfile import math os.environ['MPLCONFIGDIR'] = tempfile.mkdtemp() import argparse import numpy as np import matplotlib matplotlib.use('Agg') import matplotlib.pyplot as plt import scipy.interpolate width = 800 height = 600 lat_min = [] lon_min = [] lat_max = [] lon_max = [] # assumes lat is y, lon is x, and image is 800x600 def latToXY(lat): global width, height, lat_min, lat_max y = ((lat - lat_min) / (lat_max - lat_min)) * height #print y return y def lonToXY(lon): global width, height, lon_min, lon_max lon = math.fabs(lon) x = ((lon - lon_min) / (lon_max - lon_min)) * width #print x return x def scipy_idw(x, y, z, xi, yi): #interp = scipy.interpolate.Rbf(x, y, z, function='linear') interp = scipy.interpolate.Rbf(x, y, z) return interp(xi, yi) def plot(x,y,z,grid,legend_min,legend_max,filename): plt.figure() fig = plt.imshow(grid, vmin=legend_min, vmax=legend_max, extent=[0, 1024, 0, 768]) fig.axes.get_xaxis().set_visible(False) # hide axis labels fig.axes.get_yaxis().set_visible(False) #plt.hold(True) plt.scatter(x,y,c=z) plt.colorbar() plt.savefig(filename) # grab all floats from command line parser = argparse.ArgumentParser() parser.add_argument('--l1', type=str) parser.add_argument('--l2', type=str) parser.add_argument('--l3', type=str) parser.add_argument('--min', type=str) parser.add_argument('--max', type=str) parser.add_argument('--filename', type=str) args = parser.parse_args() # create a list by splitting at the comma l1_list = args.l1.split(',') # ['1','2','3','4'] l2_list = args.l2.split(',') l3_list = args.l3.split(',') legend_min = float(args.min) legend_max = float(args.max) filename = args.filename # convert string list to list of floats for i in range(len(l1_list)): l1_list[i] = float(l1_list[i]) l2_list[i] = float(l2_list[i]) l3_list[i] = float(l3_list[i]) lat_min = min( math.fabs(yy) for yy in l2_list ) lat_max = max( math.fabs(yy) for yy in l2_list ) lon_min = min( math.fabs(xx) for xx in l1_list ) lon_max = max( math.fabs(xx) for xx in l1_list ) # convert list of floats to x,y for i in range(len(l1_list)): l1_list[i] = lonToXY(l1_list[i]) l2_list[i] = latToXY(l2_list[i]) # convert list to numpy array x = np.array(l1_list) y = np.array(l2_list) z = np.array(l3_list) #print x #print y #print z nx, ny = 50, 50 xi, yi = np.linspace(x.min(), x.max(), nx), np.linspace(y.min(), y.max(), ny) xi, yi = np.meshgrid(xi, yi) xi, yi = xi.flatten(), yi.flatten() grid2 = scipy_idw(x,y,z,xi,yi) grid2 = grid2.reshape((ny, nx)) plot(x,y,z,grid2,legend_min,legend_max,filename) I call the script with the following parameters: plot.py --l1=-1.8791363,-1.8786206,-1.8796862,-1.878171 --l2=57.458459,57.458153,57.458495,57.458036 --l3=42.3,37.8,43.5,47.7 --min=0 --max=100 --filename=/tmp/plot.png Any help is greatly appreciated Thanks -- View this message in context: http://matplotlib.1069221.n5.nabble.com/matplolib-imshow-contour-heatmap-tp43078.html Sent from the matplotlib - users mailing list archive at Nabble.com. |
|
From: Oliver <oli...@gm...> - 2014-03-16 21:09:11
|
The matplotlib function contourf() should do what you want. Have a look at this example: http://matplotlib.org/examples/pylab_examples/contourf_demo.html I apologize if it is not what you're looking for. I haven't read your whole script, because it is not *a minimal working example* (http://www.sscce.org/) and I'm not going to do your homework. If, after having tried contourf, you find a bug or an explained feature, please do post again. 2014-03-15 19:06 GMT+01:00 sweep <rem...@gm...>: > Hi, im trying to create a heatmap/colourmap/contour style plot similar to > http://www.idlcoyote.com/cg_tips/outcontourbar.png but I cant seem to get > it > working correctly. The code takes a number of parameters on the command > line > because it is passed by an external PHP script. Essentially its a list of > lat/lon/values which I want to interpolate and plot but I cant get anything > like the image above, I cant get the vmin/vmax to work for the colorbar and > I dont know why the whole plot is squared off rather than fading to white > if > you see what I mean > > import os > import tempfile > import math > os.environ['MPLCONFIGDIR'] = tempfile.mkdtemp() > import argparse > import numpy as np > import matplotlib > matplotlib.use('Agg') > import matplotlib.pyplot as plt > import scipy.interpolate > > width = 800 > height = 600 > > lat_min = [] > lon_min = [] > lat_max = [] > lon_max = [] > > # assumes lat is y, lon is x, and image is 800x600 > def latToXY(lat): > global width, height, lat_min, lat_max > y = ((lat - lat_min) / (lat_max - lat_min)) * height > #print y > return y > > def lonToXY(lon): > global width, height, lon_min, lon_max > lon = math.fabs(lon) > x = ((lon - lon_min) / (lon_max - lon_min)) * width > #print x > return x > > def scipy_idw(x, y, z, xi, yi): > #interp = scipy.interpolate.Rbf(x, y, z, function='linear') > interp = scipy.interpolate.Rbf(x, y, z) > return interp(xi, yi) > > def plot(x,y,z,grid,legend_min,legend_max,filename): > plt.figure() > fig = plt.imshow(grid, vmin=legend_min, vmax=legend_max, extent=[0, > 1024, 0, 768]) > fig.axes.get_xaxis().set_visible(False) # hide axis labels > fig.axes.get_yaxis().set_visible(False) > #plt.hold(True) > plt.scatter(x,y,c=z) > plt.colorbar() > plt.savefig(filename) > > # grab all floats from command line > parser = argparse.ArgumentParser() > parser.add_argument('--l1', type=str) > parser.add_argument('--l2', type=str) > parser.add_argument('--l3', type=str) > parser.add_argument('--min', type=str) > parser.add_argument('--max', type=str) > parser.add_argument('--filename', type=str) > args = parser.parse_args() > > # create a list by splitting at the comma > l1_list = args.l1.split(',') # ['1','2','3','4'] > l2_list = args.l2.split(',') > l3_list = args.l3.split(',') > > legend_min = float(args.min) > legend_max = float(args.max) > filename = args.filename > > # convert string list to list of floats > for i in range(len(l1_list)): > l1_list[i] = float(l1_list[i]) > l2_list[i] = float(l2_list[i]) > l3_list[i] = float(l3_list[i]) > > lat_min = min( math.fabs(yy) for yy in l2_list ) > lat_max = max( math.fabs(yy) for yy in l2_list ) > lon_min = min( math.fabs(xx) for xx in l1_list ) > lon_max = max( math.fabs(xx) for xx in l1_list ) > > # convert list of floats to x,y > for i in range(len(l1_list)): > l1_list[i] = lonToXY(l1_list[i]) > l2_list[i] = latToXY(l2_list[i]) > > # convert list to numpy array > x = np.array(l1_list) > y = np.array(l2_list) > z = np.array(l3_list) > > #print x > #print y > #print z > nx, ny = 50, 50 > xi, yi = np.linspace(x.min(), x.max(), nx), np.linspace(y.min(), y.max(), > ny) > xi, yi = np.meshgrid(xi, yi) > xi, yi = xi.flatten(), yi.flatten() > > grid2 = scipy_idw(x,y,z,xi,yi) > grid2 = grid2.reshape((ny, nx)) > > plot(x,y,z,grid2,legend_min,legend_max,filename) > > I call the script with the following parameters: > > plot.py --l1=-1.8791363,-1.8786206,-1.8796862,-1.878171 > --l2=57.458459,57.458153,57.458495,57.458036 --l3=42.3,37.8,43.5,47.7 > --min=0 --max=100 --filename=/tmp/plot.png > > > > Any help is greatly appreciated > > Thanks > > > > -- > View this message in context: > http://matplotlib.1069221.n5.nabble.com/matplolib-imshow-contour-heatmap-tp43078.html > Sent from the matplotlib - users mailing list archive at Nabble.com. > > > ------------------------------------------------------------------------------ > Learn Graph Databases - Download FREE O'Reilly Book > "Graph Databases" is the definitive new guide to graph databases and their > applications. Written by three acclaimed leaders in the field, > this first edition is now available. Download your free book today! > http://p.sf.net/sfu/13534_NeoTech > _______________________________________________ > Matplotlib-users mailing list > Mat...@li... > https://lists.sourceforge.net/lists/listinfo/matplotlib-users > |
|
From: sweep <rem...@gm...> - 2014-03-17 19:18:47
|
Hi Oliver, thanks for the reply. I know about contourf and have tried it before but couldn't get it working, I don't really understand the data objects in python (I come from a PHP background) i.e what a numpy object is and so on, so I was hoping someone with more experience in this could help me out, hopefully take a quick look through my script and find a silly mistake. As far as my script is concerned you can just save it as a py file and run it with the params I have specified if you wanted to see it working so its not like I have done nothing and just asked for someone to write my entire script, I have spent quite some time trying to work it out for myself :) Thanks anyway -- View this message in context: http://matplotlib.1069221.n5.nabble.com/matplolib-imshow-contour-heatmap-tp43078p43086.html Sent from the matplotlib - users mailing list archive at Nabble.com. |
