Menu
▾
▴
matplotlib-devel
|
From: Eric F. <ef...@ha...> - 2015-02-16 22:01:34
|
For a long time there has been discussion of replacing the matplotlib default color map and color cycle, but we still haven't done it. We need a clear set of criteria, and a small set of good alternatives, leading to a decision, a PR, and a release. Now is the time. Here is what I think is the most recent extensive thread: http://comments.gmane.org/gmane.comp.python.matplotlib.devel/13122 Early in that thread Nathaniel Smith proposed the following criteria: - sequential, not diverging - perceptually uniform - still perceptually uniform when converted to greyscale - variation in hue is good - colorblind-friendly - hue ramp should work even without the luminance variation I added: - aesthetically pleasing Probably not all of these can be met perfectly at once, but they seem like good goals. The one most likely to be controversial is the first. I propose that we not bother arguing about it, but just accept Nathaniel's recommendation. For actual proposals: 1) A greyscale has been proposed; it satisfies several of the criteria very well, but misses by omitting hue entirely. It is proposed as a way to force users to choose something other than the default; I don't think this is a good *competitive* strategy. 2) YlGnBu or YlGnBu_r seems to me to be a viable candidate. It has the great advantage that we already have it. It seems to rate well by most of the criteria illustrated via Nathaniel's https://github.com/njsmith/pycam02ucs viscm() tool. (Perceptual distance is a little jumpy.) Others? Proposals for the new color cycle for line plots? Proposed release strategy: We will close the 1.4.x line with 1.4.3, in the process of being released now. The next step is the color change release, 2.0, based on 1.4.3, but with any additional bug fixes and other reasonably non-risky changes that are ready to go. Any substantial new features will then go in a subsequent point release. Eric |
|
From: Eric F. <ef...@ha...> - 2015-02-16 22:40:14
|
On 2015/02/16 12:01 PM, Eric Firing wrote: > > Proposals for the new color cycle for line plots? Here is a proposal: we simply adopt seaborn's cycle. Eric |
|
From: Paul H. <pmh...@gm...> - 2015-02-16 22:42:22
|
There are several cycles in seaborn. Is it safe to assume that you mean the 'deep' palette? On Mon, Feb 16, 2015 at 14:40 Eric Firing <ef...@ha...> wrote: > On 2015/02/16 12:01 PM, Eric Firing wrote: > > > > > Proposals for the new color cycle for line plots? > > Here is a proposal: we simply adopt seaborn's cycle. > > Eric > > > ------------------------------------------------------------ > ------------------ > Download BIRT iHub F-Type - The Free Enterprise-Grade BIRT Server > from Actuate! Instantly Supercharge Your Business Reports and Dashboards > with Interactivity, Sharing, Native Excel Exports, App Integration & more > Get technology previously reserved for billion-dollar corporations, FREE > http://pubads.g.doubleclick.net/gampad/clk?id=190641631& > iu=/4140/ostg.clktrk > _______________________________________________ > Matplotlib-devel mailing list > Mat...@li... > https://lists.sourceforge.net/lists/listinfo/matplotlib-devel > |
|
From: Eric F. <ef...@ha...> - 2015-02-16 23:15:33
|
On 2015/02/16 12:42 PM, Paul Hobson wrote: > There are several cycles in seaborn. Is it safe to assume that you mean > the 'deep' palette? Yes, in the sense that when I wrote the message I was just looking at seaborn's tutorial showing the default, which is 'deep'--but I didn't know it then. A good case could be made for "dark"; it has better contrast among all the colors. It might be better than "deep" for line plots, especially when the lines are thin. The main point was to get at least one plausible choice on the table. Does anyone have a suggestion for a colorblind-friendly cycle? Maybe omit the green and tack a gray on the end? I haven't checked, so I don't know if this would work well. It is common to have plots with two curves, and the present blue, green pair is not very high-contrast; having the first two colors be blue and red would be better, I think. Eric > On Mon, Feb 16, 2015 at 14:40 Eric Firing <ef...@ha... > <mailto:ef...@ha...>> wrote: > > On 2015/02/16 12:01 PM, Eric Firing wrote: > > > > > Proposals for the new color cycle for line plots? > > Here is a proposal: we simply adopt seaborn's cycle. > > Eric |
|
From: Michael W. <mw...@st...> - 2015-02-16 23:20:17
|
On Mon, Feb 16, 2015 at 3:15 PM, Eric Firing <ef...@ha...> wrote: > Does anyone have a suggestion for a colorblind-friendly cycle? Maybe > omit the green and tack a gray on the end? I haven't checked, so I > don't know if this would work well. > Here are two palettes that are optimized for colorblindness: http://www.cookbook-r.com/Graphs/Colors_%28ggplot2%29/#a-colorblind-friendly-palette Seaborn has a `colorblind` palette that is somewhere between these colors and the standard matplotlib/seaborn set. It's intended to be a little better than deep (which actually isn't too bad in terms of red vs green), but it's not been extensively tested or optimized. > It is common to have plots with two curves, and the present blue, green > pair is not very high-contrast; having the first two colors be blue and > red would be better, I think. > +1 |
|
From: Michael W. <mw...@st...> - 2015-02-16 23:21:34
|
On Mon, Feb 16, 2015 at 3:19 PM, Michael Waskom <mw...@st...> wrote: > Here are two palettes that are optimized for colorblindness actually I should say I have no idea if those are optimal, but the simulations do suggest they work well. |
|
From: Eric F. <ef...@ha...> - 2015-02-16 23:32:49
|
On 2015/02/16 1:19 PM, Michael Waskom wrote: > Here are two palettes that are optimized for colorblindness: > http://www.cookbook-r.com/Graphs/Colors_%28ggplot2%29/#a-colorblind-friendly-palette > Strange--they have both red and green, so I would never have expected them to work. The yellow looks too light to work well on a light background, especially for projecting slides. Eric |
|
From: Michael W. <mw...@st...> - 2015-02-16 23:39:20
|
It's helped by pulling the green towards blue and the red towards yellow, but they are probably the hardest to distinguish in the set. Which emphasizes that, while it's good to start with a colorblind-friendly set of colors, the person making the figure also has the responsibility to choose how to use those colors carefully so that the categories that are most important to distinguish aren't colored with red and green. On Mon, Feb 16, 2015 at 3:32 PM, Eric Firing <ef...@ha...> wrote: > On 2015/02/16 1:19 PM, Michael Waskom wrote: > >> Here are two palettes that are optimized for colorblindness: >> http://www.cookbook-r.com/Graphs/Colors_%28ggplot2%29/# >> a-colorblind-friendly-palette >> >> > Strange--they have both red and green, so I would never have expected them > to work. The yellow looks too light to work well on a light background, > especially for projecting slides. > > Eric > |
|
From: Michael W. <mw...@st...> - 2015-02-16 23:29:41
|
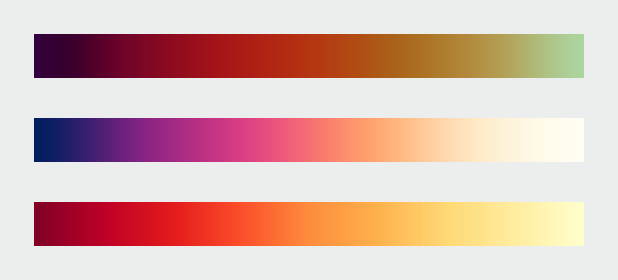
On Mon, Feb 16, 2015 at 2:01 PM, Eric Firing <ef...@ha...> wrote: > > Here is what I think is the most recent extensive thread: > http://comments.gmane.org/gmane.comp.python.matplotlib.devel/13122 ... > 1) A greyscale has been proposed; it satisfies several of the criteria > very well, but misses by omitting hue entirely. It is proposed as a way > to force users to choose something other than the default; I don't think > this is a good *competitive* strategy. > > 2) YlGnBu or YlGnBu_r seems to me to be a viable candidate. It has the > great advantage that we already have it. It seems to rate well by most > of the criteria illustrated via Nathaniel's > https://github.com/njsmith/pycam02ucs viscm() tool. (Perceptual distance > is a little jumpy.) > > Others? > Nathaniel's January 9 message in that thread (can't figure out how to link to it in the archives) had a suggestion that I thought was very promising, to do something similar to Parula but rotate around the hue circle the other direction so that the hues would go blue - purple - red - yellow. I don't think we've seen an example of exactly what it would look like, but I reckon it would be similar to the middle colormap here http://earthobservatory.nasa.gov/blogs/elegantfigures/files/2013/08/three_perceptual_palettes_618.png (from the elegant figures block series linked above), which I've always found quite attractive. |
|
From: Eric F. <ef...@ha...> - 2015-02-16 23:38:42
|
On 2015/02/16 1:29 PM, Michael Waskom wrote: > Nathaniel's January 9 message in that thread (can't figure out how to > link to it in the archives) had a suggestion that I thought was very > promising, to do something similar to Parula but rotate around the hue > circle the other direction so that the hues would go blue - purple - red > - yellow. I don't think we've seen an example of exactly what it would > look like, but I reckon it would be similar to the middle colormap here > http://earthobservatory.nasa.gov/blogs/elegantfigures/files/2013/08/three_perceptual_palettes_618.png > (from the elegant figures block series linked above), which I've always > found quite attractive. Certainly it can be considered--but we have to have a real implementation. |
|
From: Nathaniel S. <nj...@po...> - 2015-02-19 00:39:15
|
On Feb 16, 2015 3:39 PM, "Eric Firing" <ef...@ha...> wrote: > > On 2015/02/16 1:29 PM, Michael Waskom wrote: > > > Nathaniel's January 9 message in that thread (can't figure out how to > > link to it in the archives) had a suggestion that I thought was very > > promising, to do something similar to Parula but rotate around the hue > > circle the other direction so that the hues would go blue - purple - red > > - yellow. I don't think we've seen an example of exactly what it would > > look like, but I reckon it would be similar to the middle colormap here > > http://earthobservatory.nasa.gov/blogs/elegantfigures/files/2013/08/three_perceptual_palettes_618.png > > (from the elegant figures block series linked above), which I've always > > found quite attractive. > > Certainly it can be considered--but we have to have a real implementation. While I hate to promise vaporware, I actually was planning to have a go at implementing such a colormap in the next few weeks, based on optimizing the same set of parameters that viscm visualizes... FWIW. Are we planning to make other default appearance changes at the same time? The idea of changing the color cycle and/or dot-dash cycle has already come up in this thread, and this earlier thread proposed several more good ideas [1]: http://thread.gmane.org/gmane.comp.python.matplotlib.devel/13128/focus=13166 I agree that now is definitely the time to get serious about making these changes, but it seems like there's enough to be worked out that sticking to the original plan and keeping mainline quasi-frozen until 2.0 is ready might create frustration and hasty decisions. Maybe it would be less stressful all around if we let mainline development proceed at whatever pace makes sense while these things get sorted out, and then once the appearance changes are ready make the call about whether to cut a quick 1.5 first or not? Presumably these defaults will stick around for many years so it's worth taking a few months to get a complete proposal together, get feedback, etc., IMO. In an ideal world version 1.last might even provide a style.use("matplotlib2") command to preview what 2.0 will do, just like 2.0 will presumably have a style.use("matplotlib1") command for those who want to (temporarily) revert. -n [1] well I would think that wouldn't I ;-) |
|
From: Eric F. <ef...@ha...> - 2015-02-23 18:46:21
|
On 2015/02/18 2:39 PM, Nathaniel Smith wrote: > On Feb 16, 2015 3:39 PM, "Eric Firing" <ef...@ha...> wrote: >> >> On 2015/02/16 1:29 PM, Michael Waskom wrote: >> >>> Nathaniel's January 9 message in that thread (can't figure out how to >>> link to it in the archives) had a suggestion that I thought was very >>> promising, to do something similar to Parula but rotate around the hue >>> circle the other direction so that the hues would go blue - purple - red >>> - yellow. I don't think we've seen an example of exactly what it would >>> look like, but I reckon it would be similar to the middle colormap here >>> http://earthobservatory.nasa.gov/blogs/elegantfigures/files/2013/08/three_perceptual_palettes_618.png >>> (from the elegant figures block series linked above), which I've always >>> found quite attractive. >> >> Certainly it can be considered--but we have to have a real implementation. > > While I hate to promise vaporware, I actually was planning to have a > go at implementing such a colormap in the next few weeks, based on > optimizing the same set of parameters that viscm visualizes... FWIW. It might be worth quite a bit--and the sooner, the better. > > Are we planning to make other default appearance changes at the same > time? The idea of changing the color cycle and/or dot-dash cycle has > already come up in this thread, and this earlier thread proposed > several more good ideas [1]: > http://thread.gmane.org/gmane.comp.python.matplotlib.devel/13128/focus=13166 Thank you for the link. The ideas certainly deserve review at this point. There is some danger in that the more things we try to change, the harder it might be to approach consensus. > > I agree that now is definitely the time to get serious about making > these changes, but it seems like there's enough to be worked out that > sticking to the original plan and keeping mainline quasi-frozen until > 2.0 is ready might create frustration and hasty decisions. Maybe it > would be less stressful all around if we let mainline development > proceed at whatever pace makes sense while these things get sorted > out, and then once the appearance changes are ready make the call > about whether to cut a quick 1.5 first or not? Presumably these > defaults will stick around for many years so it's worth taking a few > months to get a complete proposal together, get feedback, etc., IMO. Good point; this can work provided we can keep the momentum up, so that we actually converge on a feasible proposal. > > In an ideal world version 1.last might even provide a > style.use("matplotlib2") command to preview what 2.0 will do, just > like 2.0 will presumably have a style.use("matplotlib1") command for > those who want to (temporarily) revert. I like this style-based preview idea. Eric > > -n > > [1] well I would think that wouldn't I ;-) > |
|
From: Nathaniel S. <nj...@po...> - 2015-04-05 07:20:14
Attachments:
colormap-designer-teaser.png
|
On Mon, Feb 23, 2015 at 10:46 AM, Eric Firing <ef...@ha...> wrote: > On 2015/02/18 2:39 PM, Nathaniel Smith wrote: >> >> On Feb 16, 2015 3:39 PM, "Eric Firing" <ef...@ha...> wrote: >>> >>> >>> On 2015/02/16 1:29 PM, Michael Waskom wrote: >>> >>>> Nathaniel's January 9 message in that thread (can't figure out how to >>>> link to it in the archives) had a suggestion that I thought was very >>>> promising, to do something similar to Parula but rotate around the hue >>>> circle the other direction so that the hues would go blue - purple - red >>>> - yellow. I don't think we've seen an example of exactly what it would >>>> look like, but I reckon it would be similar to the middle colormap here >>>> >>>> http://earthobservatory.nasa.gov/blogs/elegantfigures/files/2013/08/three_perceptual_palettes_618.png >>>> (from the elegant figures block series linked above), which I've always >>>> found quite attractive. >>> >>> >>> Certainly it can be considered--but we have to have a real >>> implementation. >> >> >> While I hate to promise vaporware, I actually was planning to have a >> go at implementing such a colormap in the next few weeks, based on >> optimizing the same set of parameters that viscm visualizes... FWIW. > > > It might be worth quite a bit--and the sooner, the better. While it's taking longer than hoped, just to reassure you that this isn't total vaporware, here's a screenshot from the colormap designer that Stéfan van der Walt and I have been working on... still needs fine-tuning (which at this point probably won't happen until after I get back from PyCon), but we like what we're seeing so far :-) The colormap shown has, by construction, perfect lightness linearity and perfect perceptual uniformity, according to the better-than-CIELAB model used by the viscm tool I linked upthread. -- Nathaniel J. Smith -- http://vorpus.org |
|
From: Eric F. <ef...@ha...> - 2015-04-05 07:46:47
|
On 2015/04/04 9:20 PM, Nathaniel Smith wrote: > While it's taking longer than hoped, just to reassure you that this > isn't total vaporware, here's a screenshot from the colormap designer > that Stéfan van der Walt and I have been working on... still needs > fine-tuning (which at this point probably won't happen until after I > get back from PyCon), but we like what we're seeing so far :-) > > The colormap shown has, by construction, perfect lightness linearity > and perfect perceptual uniformity, according to the better-than-CIELAB > model used by the viscm tool I linked upthread. > Thanks for the update, and the progress. The example colormap looks promising as a viable alternative. It appears to have good contrast. How well does this type of map work with the colorblindness filters? Eric |
|
From: Nathaniel S. <nj...@po...> - 2015-04-05 08:10:25
|
On Sun, Apr 5, 2015 at 12:46 AM, Eric Firing <ef...@ha...> wrote: > On 2015/04/04 9:20 PM, Nathaniel Smith wrote: > >> While it's taking longer than hoped, just to reassure you that this >> isn't total vaporware, here's a screenshot from the colormap designer >> that Stéfan van der Walt and I have been working on... still needs >> fine-tuning (which at this point probably won't happen until after I >> get back from PyCon), but we like what we're seeing so far :-) >> >> The colormap shown has, by construction, perfect lightness linearity >> and perfect perceptual uniformity, according to the better-than-CIELAB >> model used by the viscm tool I linked upthread. >> > > Thanks for the update, and the progress. The example colormap looks > promising as a viable alternative. It appears to have good contrast. How > well does this type of map work with the colorblindness filters? Blue/yellow contrast is preserved with the common types of colorblindness, so it should become a smooth ramp of blue -> (reddish/greyish, depending on details/severity of color deficiency) -> yellow. And the luminance remains linear. So it's definitely not a disaster. Beyond that I'm not entirely sure how to numerically quantify perceptual uniformity for colorblind users -- we could use the sRGB->sRGB formulas for simulating colorblindness for non-colorblind viewers and then use the regular non-colorblind uniformity estimates, but I have no idea how accurate that would be... my guess though is that the way that colormaps is designed ATM it will have somewhat faster hue shifts in the lower (blue) region than the upper (yellow) region, and fastest in the middle, though this effect shouldn't be huge (and to some extent is inevitable with any map that's both colorful and perceptually uniform for non-colorblind users). Thinking through these details is one of the things I had in mind when I mentioned "fine tuning" above though :-). We'd welcome any feedback from readers with non-simulated color deficiency! -n -- Nathaniel J. Smith -- http://vorpus.org |
|
From: Juan Nunez-I. <jni...@gm...> - 2015-04-05 07:48:16
|
<3 <3 <3 Love the prototype colormap!!! |
|
From: Benjamin R. <ben...@ou...> - 2015-04-05 21:01:05
|
That is nice. The blue is a bit heavy, but that might be my display. Now, how should we order it by default? I am used to thinking of blues as lower values, and reds as higher. The yellow at the end throws me off a bit, because I would think of it as a "weaker" color. Maybe if it was more gold-like? We should also start thinking of a snazzy name. BlRdYe probably won't cut it. Ben Root On Apr 5, 2015 3:21 AM, "Nathaniel Smith" <nj...@po...> wrote: > On Mon, Feb 23, 2015 at 10:46 AM, Eric Firing <ef...@ha...> wrote: > > On 2015/02/18 2:39 PM, Nathaniel Smith wrote: > >> > >> On Feb 16, 2015 3:39 PM, "Eric Firing" <ef...@ha...> wrote: > >>> > >>> > >>> On 2015/02/16 1:29 PM, Michael Waskom wrote: > >>> > >>>> Nathaniel's January 9 message in that thread (can't figure out how to > >>>> link to it in the archives) had a suggestion that I thought was very > >>>> promising, to do something similar to Parula but rotate around the hue > >>>> circle the other direction so that the hues would go blue - purple - > red > >>>> - yellow. I don't think we've seen an example of exactly what it would > >>>> look like, but I reckon it would be similar to the middle colormap > here > >>>> > >>>> > http://earthobservatory.nasa.gov/blogs/elegantfigures/files/2013/08/three_perceptual_palettes_618.png > >>>> (from the elegant figures block series linked above), which I've > always > >>>> found quite attractive. > >>> > >>> > >>> Certainly it can be considered--but we have to have a real > >>> implementation. > >> > >> > >> While I hate to promise vaporware, I actually was planning to have a > >> go at implementing such a colormap in the next few weeks, based on > >> optimizing the same set of parameters that viscm visualizes... FWIW. > > > > > > It might be worth quite a bit--and the sooner, the better. > > While it's taking longer than hoped, just to reassure you that this > isn't total vaporware, here's a screenshot from the colormap designer > that Stéfan van der Walt and I have been working on... still needs > fine-tuning (which at this point probably won't happen until after I > get back from PyCon), but we like what we're seeing so far :-) > > The colormap shown has, by construction, perfect lightness linearity > and perfect perceptual uniformity, according to the better-than-CIELAB > model used by the viscm tool I linked upthread. > > -- > Nathaniel J. Smith -- http://vorpus.org > > > ------------------------------------------------------------------------------ > Dive into the World of Parallel Programming The Go Parallel Website, > sponsored > by Intel and developed in partnership with Slashdot Media, is your hub for > all > things parallel software development, from weekly thought leadership blogs > to > news, videos, case studies, tutorials and more. Take a look and join the > conversation now. http://goparallel.sourceforge.net/ > _______________________________________________ > Matplotlib-devel mailing list > Mat...@li... > https://lists.sourceforge.net/lists/listinfo/matplotlib-devel > > |
|
From: Todd <tod...@gm...> - 2015-02-28 22:50:42
|
On Feb 19, 2015 1:39 AM, "Nathaniel Smith" <nj...@po...> wrote: > > On Feb 16, 2015 3:39 PM, "Eric Firing" <ef...@ha...> wrote: > > > > On 2015/02/16 1:29 PM, Michael Waskom wrote: > > > > > Nathaniel's January 9 message in that thread (can't figure out how to > > > link to it in the archives) had a suggestion that I thought was very > > > promising, to do something similar to Parula but rotate around the hue > > > circle the other direction so that the hues would go blue - purple - red > > > - yellow. I don't think we've seen an example of exactly what it would > > > look like, but I reckon it would be similar to the middle colormap here > > > http://earthobservatory.nasa.gov/blogs/elegantfigures/files/2013/08/three_perceptual_palettes_618.png > > > (from the elegant figures block series linked above), which I've always > > > found quite attractive. > > > > Certainly it can be considered--but we have to have a real implementation. > > While I hate to promise vaporware, I actually was planning to have a > go at implementing such a colormap in the next few weeks, based on > optimizing the same set of parameters that viscm visualizes... FWIW. > > Are we planning to make other default appearance changes at the same > time? The idea of changing the color cycle and/or dot-dash cycle has > already come up in this thread, and this earlier thread proposed > several more good ideas [1]: > http://thread.gmane.org/gmane.comp.python.matplotlib.devel/13128/focus=13166 > If the goal is still to put all the appearance-related changes in a single release (to simplify changes to downstream unit tests), but nobody has stepped up to make changes except to the colors, might it be possible to just adopt the default seaborn style (except for colors, of course)? If anybody is strongly motivated to make changes they can, but if nobody does there would still be a good, modern, pleasant-looking style used by default. |
|
From: Benjamin R. <ben...@ou...> - 2015-03-01 03:38:57
|
Well, since we are thinking of it... What about prettyplotlib's style? I am not sure I want to completely steal either project's style as it is their own look-n-feel (and there are some aspects of their styles I don't quite like, but I am something of a luddite...). But I would certainly be receptive to addressing whatever egregious appearance faux pas we may have. Perhaps the owners of those projects could provide use feedback on what they might consider their "short-list" for things they would fix in matplotlib? On Sat, Feb 28, 2015 at 5:50 PM, Todd <tod...@gm...> wrote: > On Feb 19, 2015 1:39 AM, "Nathaniel Smith" <nj...@po...> wrote: > > > > On Feb 16, 2015 3:39 PM, "Eric Firing" <ef...@ha...> wrote: > > > > > > On 2015/02/16 1:29 PM, Michael Waskom wrote: > > > > > > > Nathaniel's January 9 message in that thread (can't figure out how to > > > > link to it in the archives) had a suggestion that I thought was very > > > > promising, to do something similar to Parula but rotate around the > hue > > > > circle the other direction so that the hues would go blue - purple - > red > > > > - yellow. I don't think we've seen an example of exactly what it > would > > > > look like, but I reckon it would be similar to the middle colormap > here > > > > > http://earthobservatory.nasa.gov/blogs/elegantfigures/files/2013/08/three_perceptual_palettes_618.png > > > > (from the elegant figures block series linked above), which I've > always > > > > found quite attractive. > > > > > > Certainly it can be considered--but we have to have a real > implementation. > > > > While I hate to promise vaporware, I actually was planning to have a > > go at implementing such a colormap in the next few weeks, based on > > optimizing the same set of parameters that viscm visualizes... FWIW. > > > > Are we planning to make other default appearance changes at the same > > time? The idea of changing the color cycle and/or dot-dash cycle has > > already come up in this thread, and this earlier thread proposed > > several more good ideas [1]: > > > http://thread.gmane.org/gmane.comp.python.matplotlib.devel/13128/focus=13166 > > > > > If the goal is still to put all the appearance-related changes in a single > release (to simplify changes to downstream unit tests), but nobody has > stepped up to make changes except to the colors, might it be possible to > just adopt the default seaborn style (except for colors, of course)? If > anybody is strongly motivated to make changes they can, but if nobody does > there would still be a good, modern, pleasant-looking style used by default. > > > ------------------------------------------------------------------------------ > Dive into the World of Parallel Programming The Go Parallel Website, > sponsored > by Intel and developed in partnership with Slashdot Media, is your hub for > all > things parallel software development, from weekly thought leadership blogs > to > news, videos, case studies, tutorials and more. Take a look and join the > conversation now. http://goparallel.sourceforge.net/ > _______________________________________________ > Matplotlib-devel mailing list > Mat...@li... > https://lists.sourceforge.net/lists/listinfo/matplotlib-devel > > |
|
From: jni <jni...@gm...> - 2015-03-01 22:28:03
|
Hi everyone, As someone working with images, I think for displaying images you want a colormap that spans as much as possible of the luminance range. The colormap suggested by Michael Waskom would be quite perfect as-is. (recap: middle colormap here: http://earthobservatory.nasa.gov/blogs/elegantfigures/files/2013/08/three_perceptual_palettes_618.png) I understand the concern that a colormap should be able to display things on dark and light backgrounds, but this applies only to plots, not to images. Tom Caswell emphasised the distinction between colormaps for continuous variables and color cycles for categorical variables. There should also be a distinction between image display and plotting. For image display, please consider using a colormap with a wide luminance range. Thanks! -- View this message in context: http://matplotlib.1069221.n5.nabble.com/release-strategy-and-the-color-revolution-tp44929p45027.html Sent from the matplotlib - devel mailing list archive at Nabble.com. |
)
|
From: Michael W. <mw...@st...> - 2015-02-17 00:24:12
|
See [here](http://nbviewer.ipython.org/gist/mwaskom/6a43a3b94eca4a9e2e8b) for a quick and dirty implementation that should get a general idea. This probably ins't the best way to do it -- anyone should feel free to build on this. On Mon, Feb 16, 2015 at 3:38 PM, Eric Firing <ef...@ha...> wrote: > On 2015/02/16 1:29 PM, Michael Waskom wrote: > > Nathaniel's January 9 message in that thread (can't figure out how to >> link to it in the archives) had a suggestion that I thought was very >> promising, to do something similar to Parula but rotate around the hue >> circle the other direction so that the hues would go blue - purple - red >> - yellow. I don't think we've seen an example of exactly what it would >> look like, but I reckon it would be similar to the middle colormap here >> http://earthobservatory.nasa.gov/blogs/elegantfigures/ >> files/2013/08/three_perceptual_palettes_618.png >> (from the elegant figures block series linked above), which I've always >> found quite attractive. >> > > Certainly it can be considered--but we have to have a real implementation. > > |
|
From: Benjamin R. <ben...@ou...> - 2015-02-17 05:28:23
|
Do remember that I have a PR to add linestyle cycling, which would greatly mitigate problems for colorblindness and non-color publications. I also prefer it for slideshows as projectors at conferences tend to have crappy colors anyway (was at a radar conference when the projector's red crapped out while the presenter was building up suspense about the really, really impressive radar image of a supercell on the next slide) Ben Root On Feb 16, 2015 7:24 PM, "Michael Waskom" <mw...@st...> wrote: > See [here](http://nbviewer.ipython.org/gist/mwaskom/6a43a3b94eca4a9e2e8b) > for a quick and dirty implementation that should get a general idea. This > probably ins't the best way to do it -- anyone should feel free to build on > this. > > On Mon, Feb 16, 2015 at 3:38 PM, Eric Firing <ef...@ha...> wrote: > >> On 2015/02/16 1:29 PM, Michael Waskom wrote: >> >> Nathaniel's January 9 message in that thread (can't figure out how to >>> link to it in the archives) had a suggestion that I thought was very >>> promising, to do something similar to Parula but rotate around the hue >>> circle the other direction so that the hues would go blue - purple - red >>> - yellow. I don't think we've seen an example of exactly what it would >>> look like, but I reckon it would be similar to the middle colormap here >>> http://earthobservatory.nasa.gov/blogs/elegantfigures/ >>> files/2013/08/three_perceptual_palettes_618.png >>> (from the elegant figures block series linked above), which I've always >>> found quite attractive. >>> >> >> Certainly it can be considered--but we have to have a real implementation. >> >> > > > ------------------------------------------------------------------------------ > Download BIRT iHub F-Type - The Free Enterprise-Grade BIRT Server > from Actuate! Instantly Supercharge Your Business Reports and Dashboards > with Interactivity, Sharing, Native Excel Exports, App Integration & more > Get technology previously reserved for billion-dollar corporations, FREE > > http://pubads.g.doubleclick.net/gampad/clk?id=190641631&iu=/4140/ostg.clktrk > _______________________________________________ > Matplotlib-devel mailing list > Mat...@li... > https://lists.sourceforge.net/lists/listinfo/matplotlib-devel > > |
|
From: Olga B. <obo...@uc...> - 2015-02-18 02:24:50
|
Out of curiosity, what are the advantages of the HCL colormap over YlGnBu for continuous values? I'm biased towards YlGnBu because green is my favorite color and want to know what makes HCL objectively better for perceiving values. I added YlGnBu_r versions of those plots just below yours: http://nbviewer.ipython.org/gist/olgabot/6a619ef21c178801ff77 It seems it's a little more "extreme" than HCL, as in it lights are lighter and its darks are darker. From the color research, is this less desirable? On Mon Feb 16 2015 at 9:28:56 PM Benjamin Root <ben...@ou...> wrote: > Do remember that I have a PR to add linestyle cycling, which would greatly > mitigate problems for colorblindness and non-color publications. > > I also prefer it for slideshows as projectors at conferences tend to have > crappy colors anyway (was at a radar conference when the projector's red > crapped out while the presenter was building up suspense about the really, > really impressive radar image of a supercell on the next slide) > > Ben Root > On Feb 16, 2015 7:24 PM, "Michael Waskom" <mw...@st...> wrote: > >> See [here](http://nbviewer.ipython.org/gist/mwaskom/6a43a3b94eca4a9e2e8b) >> for a quick and dirty implementation that should get a general idea. This >> probably ins't the best way to do it -- anyone should feel free to build on >> this. >> >> On Mon, Feb 16, 2015 at 3:38 PM, Eric Firing <ef...@ha...> wrote: >> >>> On 2015/02/16 1:29 PM, Michael Waskom wrote: >>> >>> Nathaniel's January 9 message in that thread (can't figure out how to >>>> link to it in the archives) had a suggestion that I thought was very >>>> promising, to do something similar to Parula but rotate around the hue >>>> circle the other direction so that the hues would go blue - purple - red >>>> - yellow. I don't think we've seen an example of exactly what it would >>>> look like, but I reckon it would be similar to the middle colormap here >>>> http://earthobservatory.nasa.gov/blogs/elegantfigures/ >>>> files/2013/08/three_perceptual_palettes_618.png >>>> (from the elegant figures block series linked above), which I've always >>>> found quite attractive. >>>> >>> >>> Certainly it can be considered--but we have to have a real >>> implementation. >>> >>> >> >> >> ------------------------------------------------------------------------------ >> Download BIRT iHub F-Type - The Free Enterprise-Grade BIRT Server >> from Actuate! Instantly Supercharge Your Business Reports and Dashboards >> with Interactivity, Sharing, Native Excel Exports, App Integration & more >> Get technology previously reserved for billion-dollar corporations, FREE >> >> http://pubads.g.doubleclick.net/gampad/clk?id=190641631&iu=/4140/ostg.clktrk >> _______________________________________________ >> Matplotlib-devel mailing list >> Mat...@li... >> https://lists.sourceforge.net/lists/listinfo/matplotlib-devel >> >> ------------------------------------------------------------ > ------------------ > Download BIRT iHub F-Type - The Free Enterprise-Grade BIRT Server > from Actuate! Instantly Supercharge Your Business Reports and Dashboards > with Interactivity, Sharing, Native Excel Exports, App Integration & more > Get technology previously reserved for billion-dollar corporations, FREE > http://pubads.g.doubleclick.net/gampad/clk?id=190641631& > iu=/4140/ostg.clktrk_______________________________________________ > Matplotlib-devel mailing list > Mat...@li... > https://lists.sourceforge.net/lists/listinfo/matplotlib-devel > |
|
From: Michael W. <mw...@st...> - 2015-02-18 02:46:33
|
Hey Olga, On Tue, Feb 17, 2015 at 6:24 PM, Olga Botvinnik <obo...@uc...> wrote: > Out of curiosity, what are the advantages of the HCL colormap over YlGnBu > for continuous values? I'm biased towards YlGnBu because green is my > favorite color and want to know what makes HCL objectively better for > perceiving values. > Perceptually, the luminance ramp is probably a bit more linear, but that's not a huge deal. The main functional advantage to using *some* kind of Hcl based map is that it lets matplotlib tweak more parameters. This particular Hcl map has a bit more hue variation than YlBuGn, and I think the saturation channel is doing something different than what the colorbrewer maps do. So it appears a little bit more "colorful", which I think was one of the objectives. I think there's some argument for matplotlib creating a novel colormap for its default rather than just using one of the preset colorbrewer ones. It would be nice to have a bit more well-defined visual identity, and having people say "oh hey that's the matplotlib colormap, it looks really nice!" might have good marketing benefits. I like the colorbrewer palettes and use them often, but it seems kind of boring to take an existing colormap that lots of packages have and make it the default. > I added YlGnBu_r versions of those plots just below yours: > http://nbviewer.ipython.org/gist/olgabot/6a619ef21c178801ff77 > > It seems it's a little more "extreme" than HCL, as in it lights are > lighter and its darks are darker. From the color research, is this less > desirable? > Well, that could be changed in the Hcl version by setting different endpoints for the lightness ramp. I was trying to get something similar to parula, which doesn't cover as extreme of a lightness range and is more saturated on both ends than the color brewer palettes. I would imagine the reasoning for this is that it might let the map represent categorical or divergent data a little bit better without much cost to sequential data, but I am not sure. Also, if you map a line or scatter plot with YlGnBu, the lightest colors might not be visible on a white background, whereas I think the yellow I used would be ok. This might be something to keep in mind as the map that gets chosen will likely be the default for plt.scatter. But like I said, I didn't spend much time thinking about exactly where the endpoints should be, so it's possible one would want more dynamic luminance range. Michael > On Mon Feb 16 2015 at 9:28:56 PM Benjamin Root <ben...@ou...> wrote: > >> Do remember that I have a PR to add linestyle cycling, which would >> greatly mitigate problems for colorblindness and non-color publications. >> >> I also prefer it for slideshows as projectors at conferences tend to have >> crappy colors anyway (was at a radar conference when the projector's red >> crapped out while the presenter was building up suspense about the really, >> really impressive radar image of a supercell on the next slide) >> >> Ben Root >> On Feb 16, 2015 7:24 PM, "Michael Waskom" <mw...@st...> wrote: >> >>> See [here](http://nbviewer.ipython.org/gist/mwaskom/6a43a3b94eca4a9e2e8b) >>> for a quick and dirty implementation that should get a general idea. This >>> probably ins't the best way to do it -- anyone should feel free to build on >>> this. >>> >>> On Mon, Feb 16, 2015 at 3:38 PM, Eric Firing <ef...@ha...> wrote: >>> >>>> On 2015/02/16 1:29 PM, Michael Waskom wrote: >>>> >>>> Nathaniel's January 9 message in that thread (can't figure out how to >>>>> link to it in the archives) had a suggestion that I thought was very >>>>> promising, to do something similar to Parula but rotate around the hue >>>>> circle the other direction so that the hues would go blue - purple - >>>>> red >>>>> - yellow. I don't think we've seen an example of exactly what it would >>>>> look like, but I reckon it would be similar to the middle colormap here >>>>> http://earthobservatory.nasa.gov/blogs/elegantfigures/ >>>>> files/2013/08/three_perceptual_palettes_618.png >>>>> (from the elegant figures block series linked above), which I've always >>>>> found quite attractive. >>>>> >>>> >>>> Certainly it can be considered--but we have to have a real >>>> implementation. >>>> >>>> >>> >>> >>> ------------------------------------------------------------------------------ >>> Download BIRT iHub F-Type - The Free Enterprise-Grade BIRT Server >>> from Actuate! Instantly Supercharge Your Business Reports and Dashboards >>> with Interactivity, Sharing, Native Excel Exports, App Integration & more >>> Get technology previously reserved for billion-dollar corporations, FREE >>> >>> http://pubads.g.doubleclick.net/gampad/clk?id=190641631&iu=/4140/ostg.clktrk >>> _______________________________________________ >>> Matplotlib-devel mailing list >>> Mat...@li... >>> https://lists.sourceforge.net/lists/listinfo/matplotlib-devel >>> >>> ------------------------------------------------------------ >> ------------------ >> Download BIRT iHub F-Type - The Free Enterprise-Grade BIRT Server >> from Actuate! Instantly Supercharge Your Business Reports and Dashboards >> with Interactivity, Sharing, Native Excel Exports, App Integration & more >> Get technology previously reserved for billion-dollar corporations, FREE >> http://pubads.g.doubleclick.net/gampad/clk?id=190641631& >> iu=/4140/ostg.clktrk_______________________________________________ >> Matplotlib-devel mailing list >> Mat...@li... >> https://lists.sourceforge.net/lists/listinfo/matplotlib-devel >> > |
|
From: Maximilian A. <max...@gm...> - 2015-02-18 16:17:58
Attachments:
viscm_screenshot.png
|
2015-02-17 1:23 GMT+01:00 Michael Waskom <mw...@st...>: > See [here](http://nbviewer.ipython.org/gist/mwaskom/6a43a3b94eca4a9e2e8b) > for a quick and dirty implementation that should get a general idea. This > probably ins't the best way to do it -- anyone should feel free to build on > this. > This is very neat! Great job. Incidentally, when I stumbled upon the earthobservatory blog a while ago this particular colormap also caught my eye as a potential candidate, so I'm glad you suggested it as a starting point for a new matplotlib default. Out of curiosity, I applied Nathaniel's "viscm" function (from the previous thread) to the colormap from your notebook (screenshot attached). Interestingly, while it confirms that the lightness and hue angle increase more or less linearly, the "colourfulness" goes up and down in waves, even though you designed the chroma to increase linearly, too. I'm not sure whether this is because "colourfulness" and "chroma" are actually two different concepts, or whether it has to do with inaccuracies and/or clamping during the conversion between various colour spaces. It could also be the case that the colormath and pycam02ucs modules use different conversion formulas (in which case it would be good to know which is "more accurate"; not sure there is even an objective measure for "accuracy" in this case). Also, there seems to be something strange going on at the dark (blue) end of the colormap, but this could again be due to clamping. I'd love to play a bit more with your example notebook but not sure I'll be able to do so before the weekend (or early next week). Cheers, Max |
×

Want the latest updates on software, tech news, and AI?
Get latest updates about software, tech news, and AI from SourceForge directly in your inbox once a month.
Thanks for helping keep SourceForge clean.
X