Menu
▾
▴
2 Attachments
#285 Is there a way to plot a point (x,y) in a smooth cnorm curve?
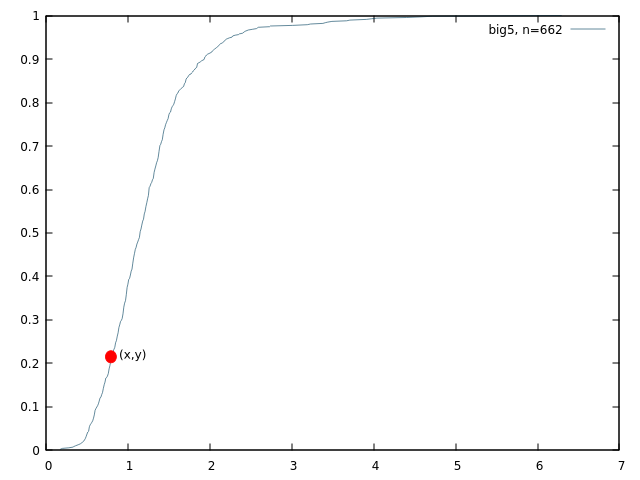
Let's say we have a dataset, we plot a cumulative normalized distribution, and then we want to see or highlight a desired value to see where it falls in the percentile curve by plotting a single point.
So far,
set datafile separator ","
set datafile missing ""
stats '< awk ''BEGIN{FS="," ; OFS=","} $8 >= 10 && $4 ~ /DF/'' ./assets/final_big5_defensive-actions.dat' u 21 name "a" nooutput
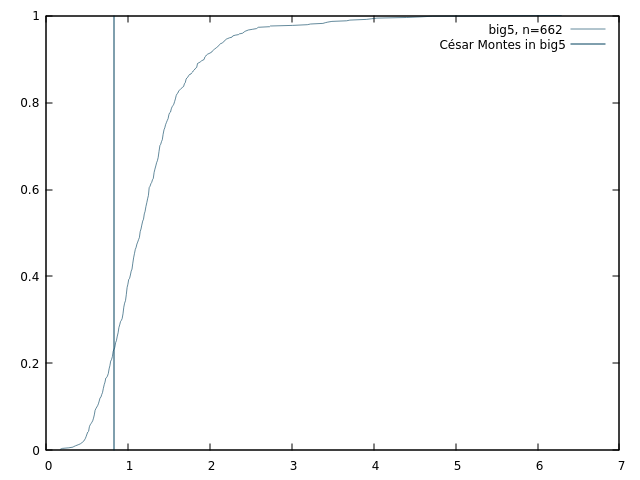
plot '< awk ''BEGIN{FS="," ; OFS=","} $8 >= 10 && $4 ~ /DF/'' ./assets/final_big5_defensive-actions.dat' u 21:(1.0) smooth cnorm with lines lc "#64003f5c" t sprintf("big5, n=%d", a_records),\
'< grep "César Montes" ./assets/final_big5_defensive-actions.dat' u 21:(1.0) with impulses lc "#003f5c" t "César Montes in big5"
pause -1
This method of is ok for one value, but perhaps you want three or six, then it becomes too cluttered, that is why I'm trying to find out if there is a way to plot only the points and perhaps the (x, y) values next to them.
Something like this,