Menu
▾
▴
2 Attachments
#261 For time series data, Is it possible to plot/add 0 when the data set does not include it?
None
closed
nobody
5
2025-12-16
2020-12-04
No
DATA SAMPLE
DATE             EVENT COUNT
2020-05-02       2
2020-05-04       1
2020-05-05       2
2020-05-06       1
2020-05-07       1
2020-05-08       2
2020-05-12       1
2020-05-16       1
2020-05-17       1
2020-05-18       3
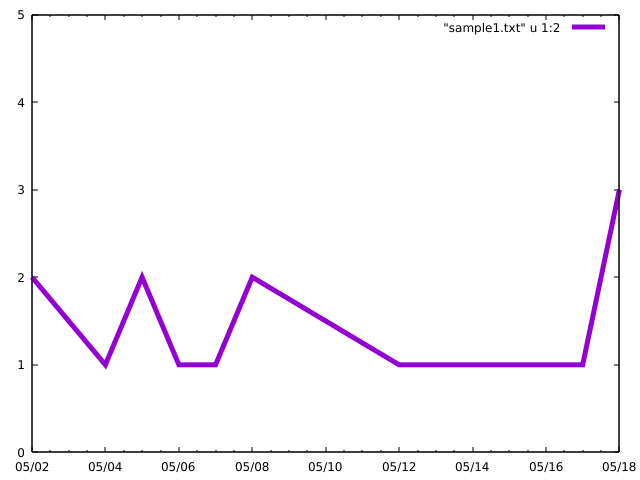
As it can be seen, the set is missing the date/event pairs when there is no event occurrence, it jumps from may 2 to may 3, from may 8 to may 12, from may 12 to may 16. Is it possible to manipulate/edit the data so that Gnuplot reads/plots it as if it were like this:
DATE        EVENT COUNT
2020-05-02  2
2020-05-03  0
2020-05-04  1
2020-05-05  2
2020-05-06  1
2020-05-07  1
2020-05-08  2
2020-05-09  0
2020-05-10  0
2020-05-11  0
2020-05-12  1
2020-05-13  0
2020-05-14  0
2020-05-15  0
2020-05-16  1
2020-05-17  1
2020-05-18  3
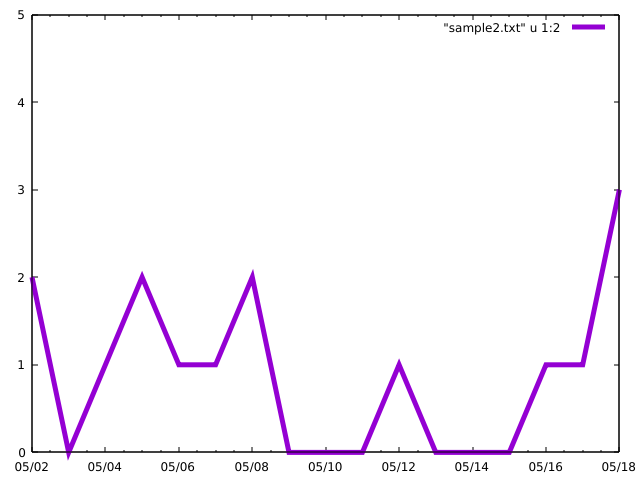


This can be done with bins. The width of each bin is 1 day or 60*60*24 seconds.