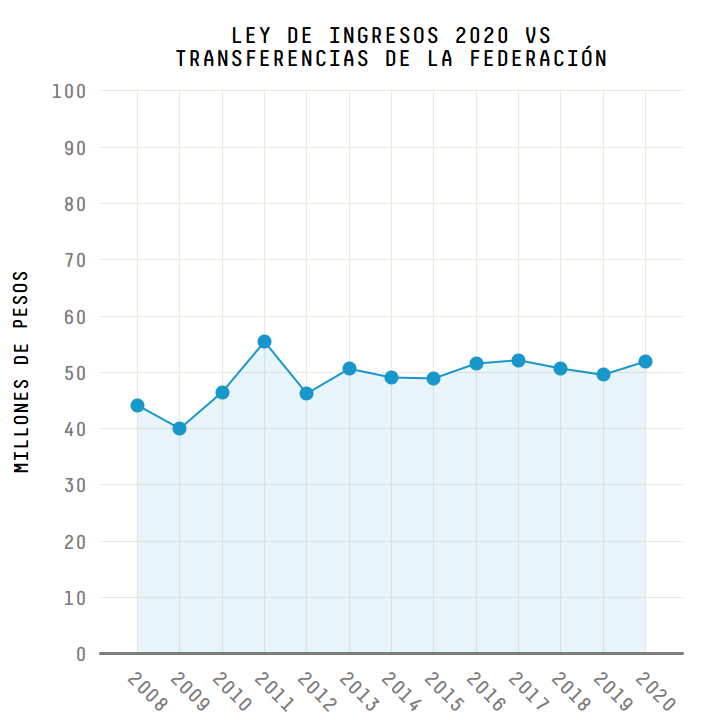
I've been wanting to ask about this for a while, here is an example of a graph generated using the same code but with different terminals:
set term pngcairo size 720,720
set terminal svg size 720, 720 fixed (look at GUI for pixel sizes)
set terminal svg size 720, 720 dynamic (look at GUI for pixel sizes)
As you can see the SVG files render in different sizes in Inkscape, and Firefox (600x480), compared to the PNG.
I want to be able to open or render the SVG file and for it to look similar/identical to the PNG file. What am I doing wrong?
my gnuplot code:
#settermpngcairosize720,720;#settermpngcairofont"DecimaMonoPro, 15"enhanced;setterminalsvgsize720,720fixedsetterminalsvgfont"DecimaMonoPro, 15"enhanced;setstylefilltransparentsolid.1;setstylefillnoborder;unsetkey;setsizeratio1setborder1;setborderlc'#7F7C7C'lw'3'settitle"LEY DE INGRESOS 2020 VS\nTRANSFERENCIAS DE LA FEDERACIÓN";settitlefont'DecimaMonoPro, 17'setylabel"MILLONES DE PESOS";setxtics1rotateby-45;setytics10;setxticsoffset-1.2;setxticsscale0;setyticsscale0;#setxticsfont'DecimaMonoPro, 21';#setyticsfont"DecimaMonoPro, 22";setgridsetgridylt-1lw1.2lc"#ECE9E1"plot[2007.1:2020.9][0:100]'Grafica_Ley_Ingresos_2020/LeyIng.dat'using1:3withfilledcurvesx1lc"#1897CB",\''using1:3withlplt7lw2ps2lc"#1897CB";pause-1;
I speculate your post may be inspired by the one by mine just earlier. This contributes to my interest to your post and this initial comment, because in my current perception of you question, the different size ratio of the dots to the overall dimension of the canvas / the line width either is / or is one point you understanably would like to keep consistent across the interfaces the file is read.
For future reference, I suggest for one that the output .svg files are not posted as code snippets (with Ctrl-Alt-C). Instead, a post is more accessible if .svg are provided as files; for this, the «add attachments» below the message box allows to add multiple files at once. Basically copy-pasting the two corresponding sections into an editor, then saving them as .svg here.
Because the gnuplot generated .svg are text files, it is possible to compare them side-by-side. If you like to use a GUI, kdiff3 kdiff3 is an example. If you installed the git version managment, the then accessible diff utility offers the rapid check by
diff -s svg_dynamic.svg svg_fixed.svg
to report
Files svg_dynamic.svg and svg_fixed.svg are identical
The second comment is about the code shared by you. It will not work as such on other's computer because it calls for an external data file which (at present) is not provided here. However, because your question is about the different display of the .svg in either web browser, or inkscape, this may be of lesser relevance for now. It equally may be more portable to others if gnuplot is instructed to call a more common font -- such as Arial -- than DecimaMonoPro because even if gnuplot were unable to find Arial as such on the currently used operating system, cairo-based terminals (e.g., pdfcairo, pngcairo) would reach out for fontconfig to find a similar substitute (cf. manual of gnuplot 5.0.7 by august 2017).
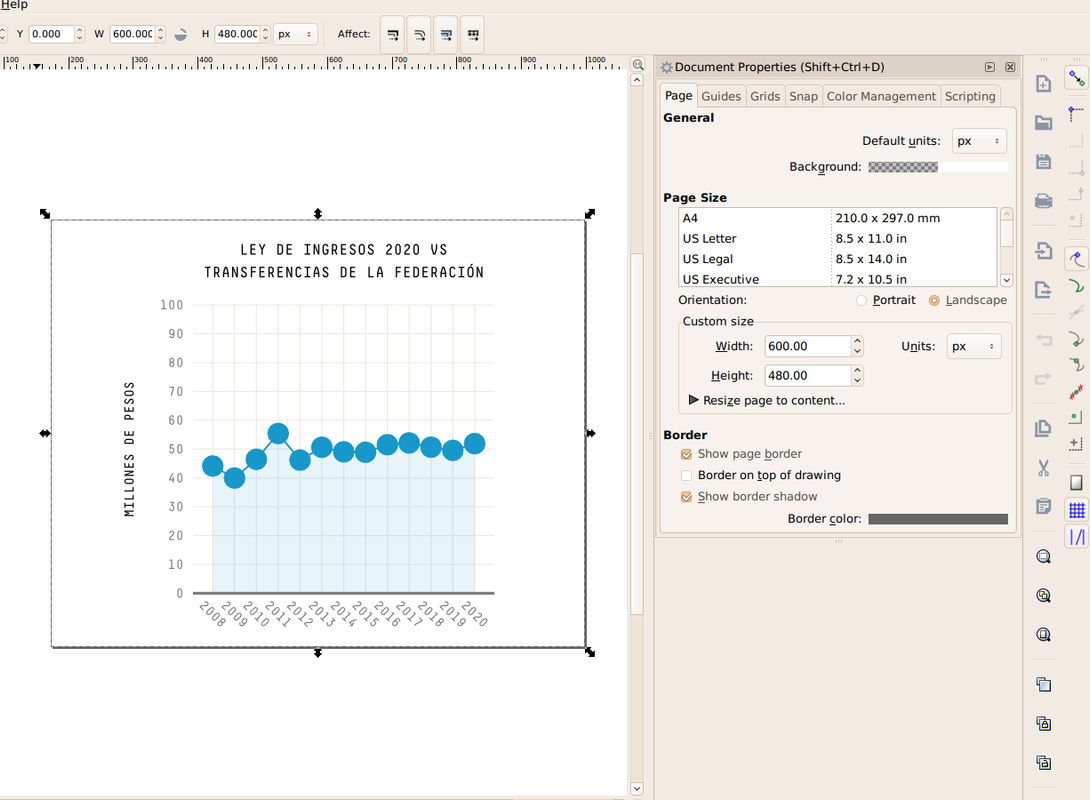
As documented in the attached screen photo, comparing the display of the display of svg_fixed.svg in either Firefox (72.0.1 (64-bit)) or inkscape (0.92.3 (2405546, 2018-03-11)), I found in both the dot size relatively large in comparsion of the overall scale, yet similar.
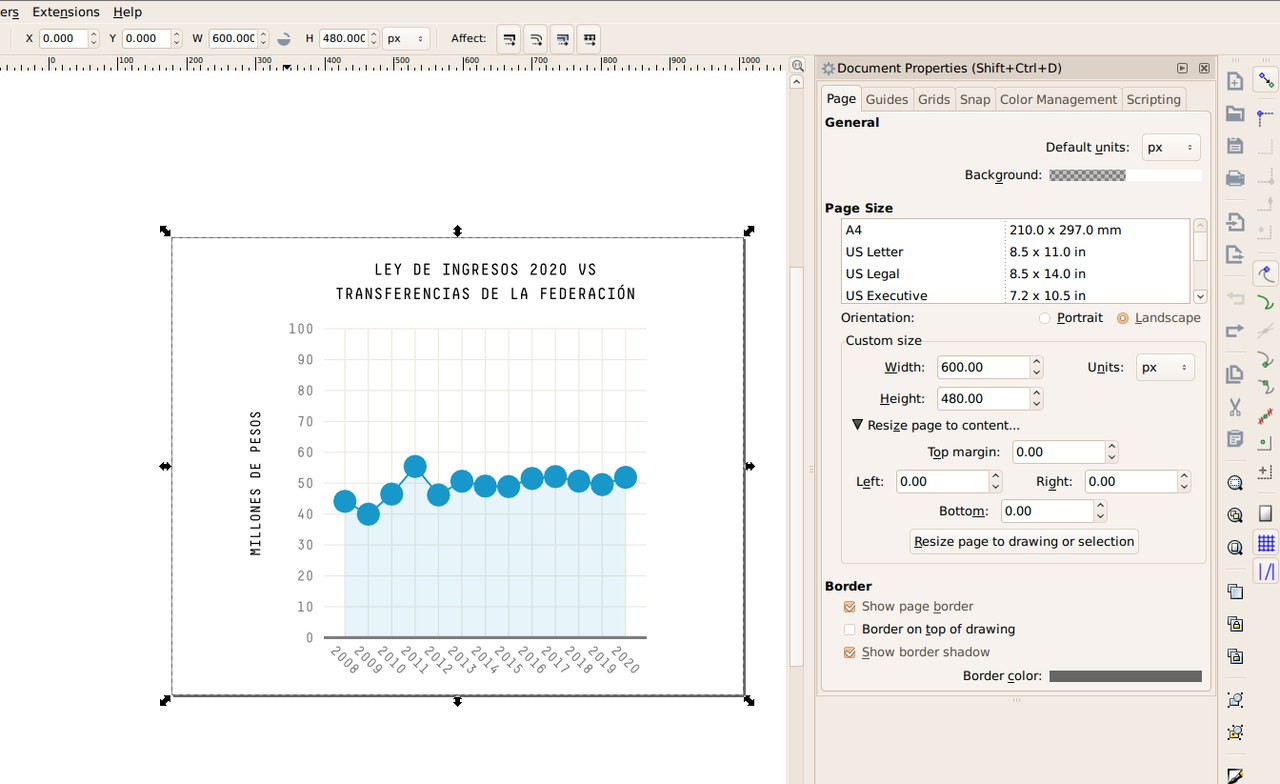
In absence of the original data read by gnuplot, as there are so few dots, you still may read the .svg in inkscape, 1) ungroup the drawing-as-whole, and 2) ungroup the line with the dots. Now, selecting each dot for itself, 3) each one could be scaled to say 50% (Object -> Transform) as illustrated in dot_size.png. (If all are selected at once, you risk that the transformation equally affects the arrangment of the dots.)
I've been wanting to ask about this for a while, here is an example of a graph generated using the same code but with different terminals:
set term pngcairo size 720,720
set terminal svg size 720, 720 fixed (look at GUI for pixel sizes)
set terminal svg size 720, 720 dynamic (look at GUI for pixel sizes)
As you can see the SVG files render in different sizes in Inkscape, and Firefox (600x480), compared to the PNG.
I want to be able to open or render the SVG file and for it to look similar/identical to the PNG file. What am I doing wrong?
my gnuplot code:
**SVG FIXED gnuplot generated file: **
SVG DYNAMIC gnuplot generated file:
Thanks
Hi Roge,
I speculate your post may be inspired by the one by mine just earlier. This contributes to my interest to your post and this initial comment, because in my current perception of you question, the different size ratio of the dots to the overall dimension of the canvas / the line width either is / or is one point you understanably would like to keep consistent across the interfaces the file is read.
For future reference, I suggest for one that the output .svg files are not posted as code snippets (with Ctrl-Alt-C). Instead, a post is more accessible if .svg are provided as files; for this, the «add attachments» below the message box allows to add multiple files at once. Basically copy-pasting the two corresponding sections into an editor, then saving them as .svg here.
Because the gnuplot generated .svg are text files, it is possible to compare them side-by-side. If you like to use a GUI, kdiff3 kdiff3 is an example. If you installed the git version managment, the then accessible diff utility offers the rapid check by
to report
The second comment is about the code shared by you. It will not work as such on other's computer because it calls for an external data file which (at present) is not provided here. However, because your question is about the different display of the .svg in either web browser, or inkscape, this may be of lesser relevance for now. It equally may be more portable to others if gnuplot is instructed to call a more common font -- such as Arial -- than DecimaMonoPro because even if gnuplot were unable to find Arial as such on the currently used operating system, cairo-based terminals (e.g., pdfcairo, pngcairo) would reach out for
fontconfigto find a similar substitute (cf. manual of gnuplot 5.0.7 by august 2017).As documented in the attached screen photo, comparing the display of the display of svg_fixed.svg in either Firefox (72.0.1 (64-bit)) or inkscape (0.92.3 (2405546, 2018-03-11)), I found in both the dot size relatively large in comparsion of the overall scale, yet similar.
In absence of the original data read by gnuplot, as there are so few dots, you still may read the .svg in inkscape, 1) ungroup the drawing-as-whole, and 2) ungroup the line with the dots. Now, selecting each dot for itself, 3) each one could be scaled to say 50% (Object -> Transform) as illustrated in dot_size.png. (If all are selected at once, you risk that the transformation equally affects the arrangment of the dots.)
Norwid