JavaScript InfoVis ToolkitSenchaLabs
|
||||||
Related Products
|
||||||
About
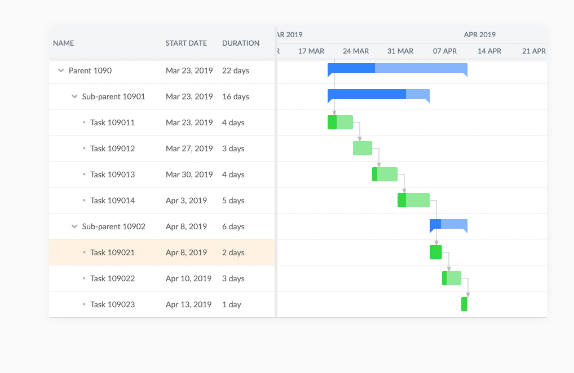
Bryntum is a leading provider of high-performance scheduling solutions for the web. Our suite of JavaScript components—including Gantt, Scheduler, Task Board, and Calendar—enables developers to build modern project management applications with features like drag-and-drop scheduling, resource management, and interactive timelines. Seamless integration with popular frameworks such as React, Angular, Vue, and Ext JS ensures flexibility and rapid implementation. From streamlining planning workflows to visualizing complex schedules and optimizing resource allocation, Bryntum’s solutions empower organizations across industries to deliver robust, intuitive project planning tools at scale.
|
About
The JavaScript InfoVis Toolkit provides tools for creating interactive data visualizations for the web. The best way to start is to take a look at the demos page. Each demo has a See the Example Code link that takes you to the code for that example. The actual library code is included in the HTML file by building the lib each time with only the needed requirements taken from the name of the visualization and the build.json file. The required library code is built by the build.py file. In order to create a new visualization you need to set up the server environment to include test JavaScript files for your new visualization and also you need to add the new visualization files into the Source folder.
|
|||||
Platforms Supported
Windows
Mac
Linux
Cloud
On-Premises
iPhone
iPad
Android
Chromebook
|
Platforms Supported
Windows
Mac
Linux
Cloud
On-Premises
iPhone
iPad
Android
Chromebook
|
|||||
Audience
Web Developers, Full Stack Developers, UX, PM, Project Managers
|
Audience
Developers in need of a tool for creating interactive data visualizations for the web
|
|||||
Support
Phone Support
24/7 Live Support
Online
|
Support
Phone Support
24/7 Live Support
Online
|
|||||
API
Offers API
|
API
Offers API
|
|||||
Screenshots and Videos |
Screenshots and Videos |
|||||
Pricing
$680
Free Version
Free Trial
|
Pricing
Free
Free Version
Free Trial
|
|||||
Reviews/
|
Reviews/
|
|||||
Training
Documentation
Webinars
Live Online
In Person
|
Training
Documentation
Webinars
Live Online
In Person
|
|||||
Company InformationBryntum
Founded: 2009
Sweden
www.bryntum.com
|
Company InformationSenchaLabs
Founded: 2013
United States
philogb.github.io/jit/
|
|||||
Alternatives |
Alternatives |
|||||
|
|
||||||
|
|
||||||
|
|
|
|||||
Categories |
Categories |
|||||
Gantt Chart Features
Alerts/Notifications
Capacity Monitoring
Color Coding
Dependency Tracking
Drag & Drop
Milestone Tracking
Progress Tracking
Task Management
Templates
|
||||||
|
|
|