DebugSwift is a comprehensive open-source toolkit aimed at iOS developers that streamlines and enhances the debugging experience for Swift-based applications by providing a rich set of interactive diagnostic tools. Designed to operate within the iOS environment (iOS 14+ and Swift 6+), it includes network and WebSocket inspectors for HTTP requests, detailed performance metrics (CPU, memory, FPS), and mechanisms to detect memory leaks and main thread violations in real time. The toolkit also provides developers with crash analysis features, console log monitoring, device and build information displays, and customizable debugging panels, all of which make it easier to troubleshoot edge cases and unexpected behavior. Interface inspection tools like grid overlays, 3D view hierarchy exploration, and touch indicators help visualize UI layouts and interactions directly on the device, giving developers immediate context into how their app behaves.
Features
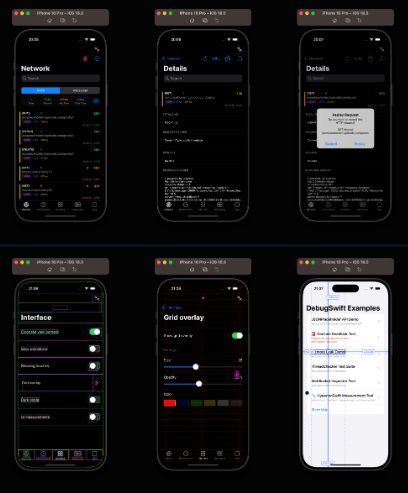
- Network and WebSocket inspection tools
- Real-time performance monitoring
- Crash report analysis with stack traces
- Interactive UI inspection and view hierarchy tools
- Memory leak detection and debug actions
- Console monitoring and device info display
Project Samples