Menu
▾
▴
Re: [Valgrind-users] massif visualisation app
|
From: Julian S. <js...@ac...> - 2008-01-31 12:44:31
|
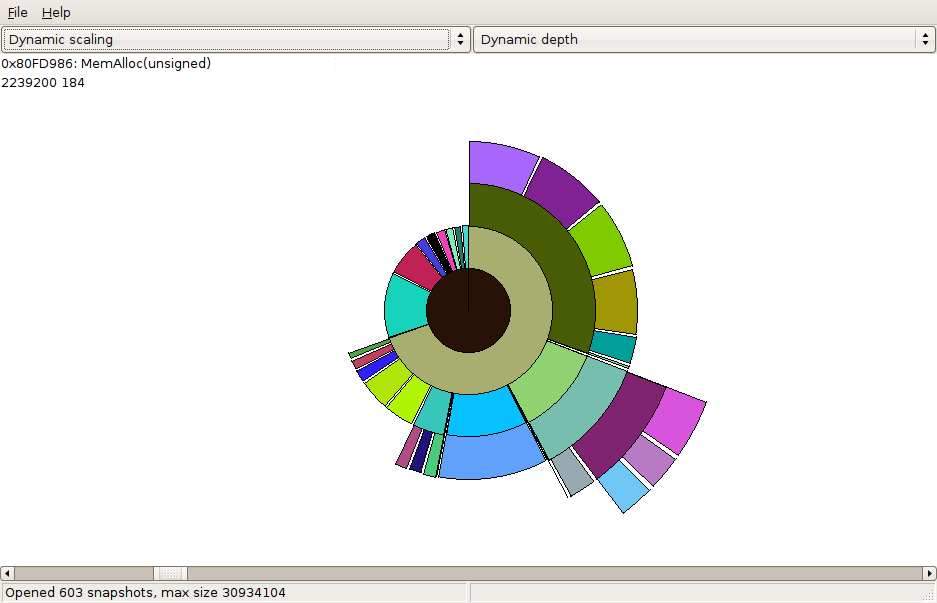
On Thursday 31 January 2008 06:19, Nicholas Nethercote wrote: > On Thu, 31 Jan 2008, Martijn Versteegh wrote: > > I created a small visualisation application which reads in the > > massif.out.<pid> files that massif produces, and visualises them in a > > way similar to filelight or baobab (aka gnome disk usage analiser) > > > > A screenshot is here: > > http://www.aaltjegron.nl/projects/msplot/msplot.jpg > > Nice! I was hoping somebody would do something like this. (Josef did it > for Cachegrind :) Yes; let me second that - it's great to see. I am pleased that we shipped a new and improved Massif in 3.3.0 and so it's cool to see a GUI for navigating the results. I would encourage you to make the sources available, so people can try it out. Also, it may then happen that you get a number of requests-for-change needed to make it support large applications. Generally, we find that for a tool to be widely used it needs to be able to work well with really huge applications. Think OOo sized: 6+ million LOC. Without having tried it, it's hard to give specific feedback, however I do have a couple of comments: > callgraphs. the name of the block the mouse is over is printed in the > top-left corner. I think that might get annoying for large apps. Perhaps there can be a way to click on a slice and have the resulting info written permanently in the left side of the window? So that then you can click on several slices and see/compare the detailed info? Or something like that. Second comment is that I suspect to be really useful for large apps, you will need to provide some kind of filtering of results. Someone space-profiling (eg) OOo or Firefox will just be working on one specific aspect of that application -- they are so large there is no way they could be working on all parts at once. In particular maybe something like, select one segment and make that be the center of the circle (so that the stuff that was now "outside" the segment is around it. Effectively this restricts the view to all allocations that end in the chain of calls represented by moving from that segment into the (old) middle of the picture. If that makes any sense ... IMO one of the things that makes KCachegrind a killer application is that it can do just this kind of filtering. Eg, just show me the performance information (time, cycles, etc) resulting from calls made by some function 'f' (and its children) (or made to function 'f'). So you can use it to navigate the performance data from large applications without being totally confused by information from parts of the application you are not interested in. J |